The problem with Jira's default sprint view
Jira's sprint board tells you one thing: which column each ticket is in. To Do, In Progress, Done. That's useful — but it isn't sprint health. An issue marked "In Progress" could be hours from done or just starting. You can't tell from the label.
The built-in Sprint Report focuses on story points completed vs remaining. That tells you how much work has left the sprint, not how far along the remaining work is. On day nine of a two-week sprint, knowing that four tickets are "In Progress" is very different from knowing they're each at 80% — or each at 10%.
Quick answer: Jira does not show per-issue progress percentages by default. You add that layer with a progress bar custom field and a dashboard gadget — neither requires JQL knowledge or scripting.
What sprint health actually means
A healthy sprint has three properties:
- In-progress items are advancing. Not just labeled "In Progress" by status, but genuinely moving forward day over day.
- No hidden blockers. An issue that has been "In Progress" for six days without movement is a risk signal — whether or not it has a formal blocker tag.
- The overall completion rate is on track. If the sprint has ten stories and it's day eight of ten, an average progress below 70% warrants a conversation.
None of these are visible in Jira's default views. You need progress information at the issue level, not just at the status level.
Progress bars: the missing layer
Adding a progress bar custom field gives each issue a color-coded bar and a percentage. That percentage can come from one of three sources:
- Status-based: automatically maps each workflow status to a percentage. When someone moves a ticket from "In Progress" to "In Review", the bar advances from 50% to 75% with no extra clicks. You configure the mapping once in Admin Settings.
- Subtask-based: calculates resolved subtasks ÷ total subtasks. Useful for stories with detailed acceptance criteria broken into child issues.
- Manual: the assignee sets the percentage themselves using a slider or quick-select buttons (0%, 25%, 50%, 75%, 100%). Useful for tasks where status alone does not capture complexity.
The color coding is configurable: red below 34%, yellow up to 67%, green above — or whatever thresholds fit your team's definition of "at risk". The same thresholds apply everywhere the field appears: the issue view, the list view column, and the dashboard. For the deeper walkthrough of these three field types — including how each one updates and which fits which kind of work — see Jira Progress Bar: How to Track Issue Progress Visually.
Sprint health in the list view
Once a progress bar field exists, add it as a column to your Jira list view or backlog. During standup, open the list view and sort by progress ascending. The lowest-progress in-progress items surface at the top — those are the tickets that need a conversation.
A sprint full of yellow and green bars on day three looks very different from one full of red on day nine. That difference is visible in a glance rather than buried in a report.
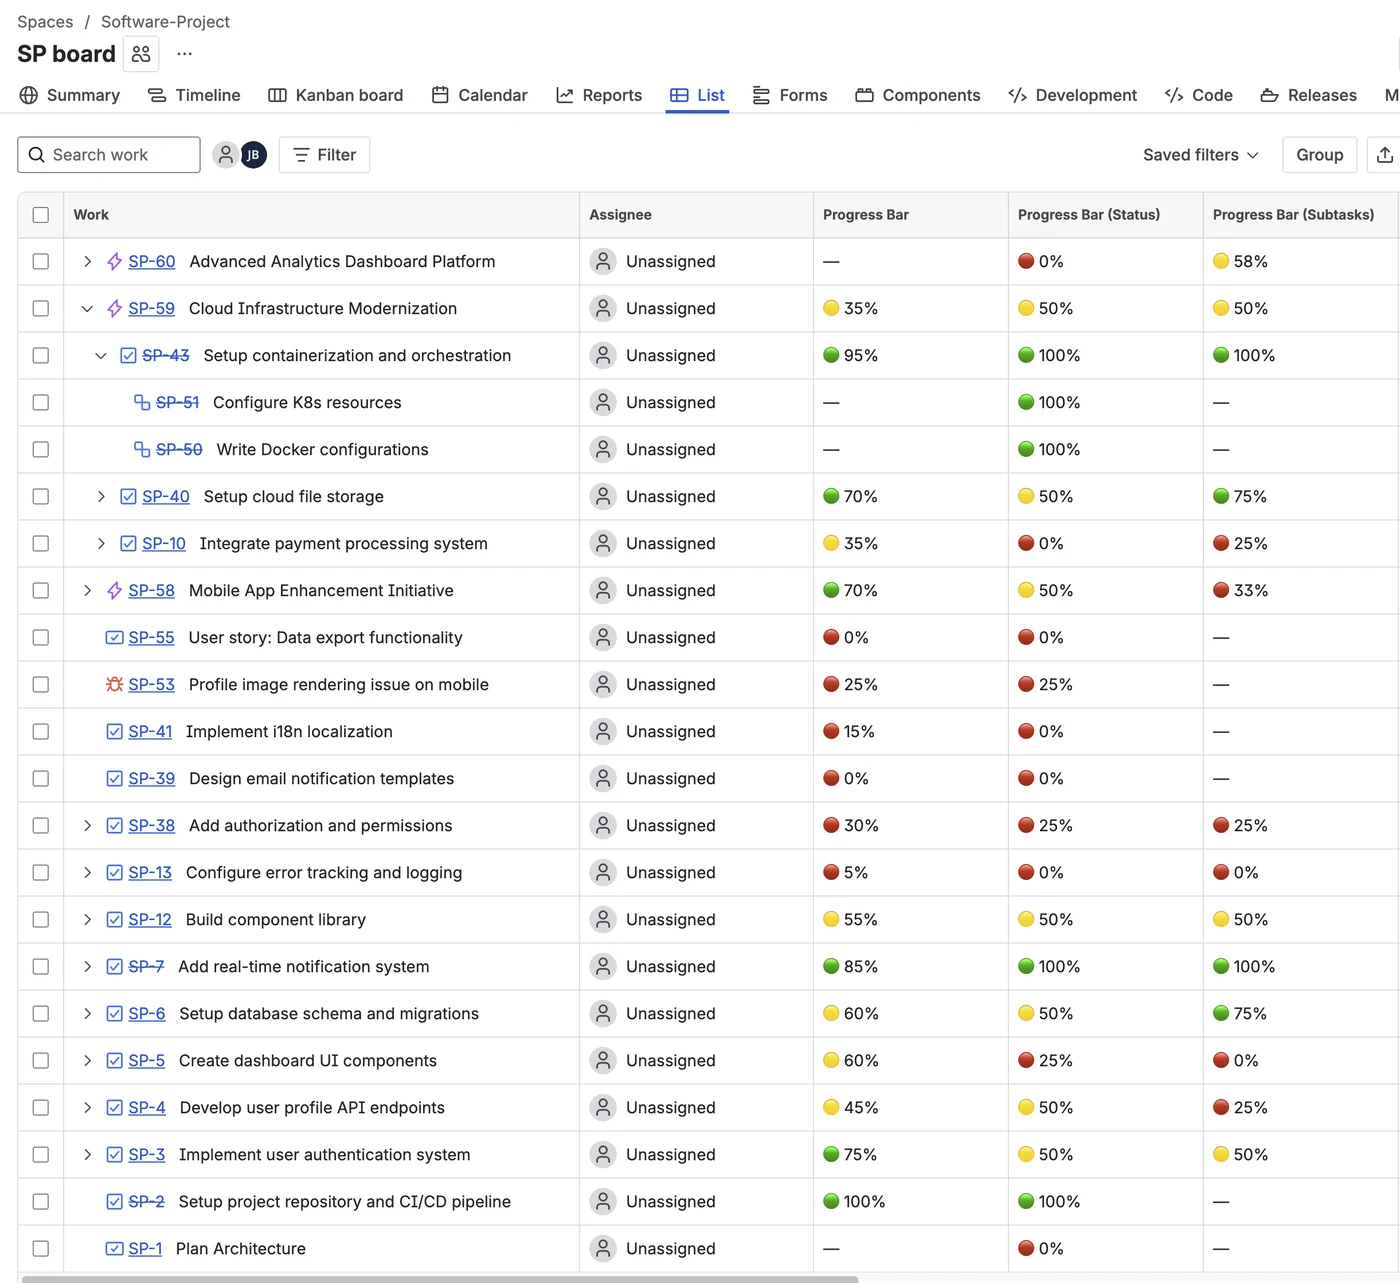
Progress bar column in the Jira list view — sort ascending to bring at-risk items to the top
Tip: Sort any progress column ascending to surface issues at 0% mid-sprint. An issue with zero progress in the second half of a sprint is a concrete conversation starter — not a vague "is this on track?" question.
The dashboard gadget: a sprint-level overview
The Visual Progress Tracker dashboard gadget — called Progress Tracker Overview — gives you a table of all issues in a project, each with a progress bar, plus an overall average completion percentage at the top.
To scope it to your active sprint, use the optional JQL filter when configuring the gadget. Enter sprint in openSprints() to show only issues in the current sprint. Combine it with type = Story if you only want stories, not sub-tasks.
The table shows each issue's key, summary, type, status, and a progress bar. Any column is sortable — clicking the Progress header lets you rank issues by completion. The average at the top gives you a single number: how done is this sprint right now.
The gadget caches data for up to one hour to keep Jira API usage low. A Refresh button and a "X minutes ago" indicator give you control over when it updates.
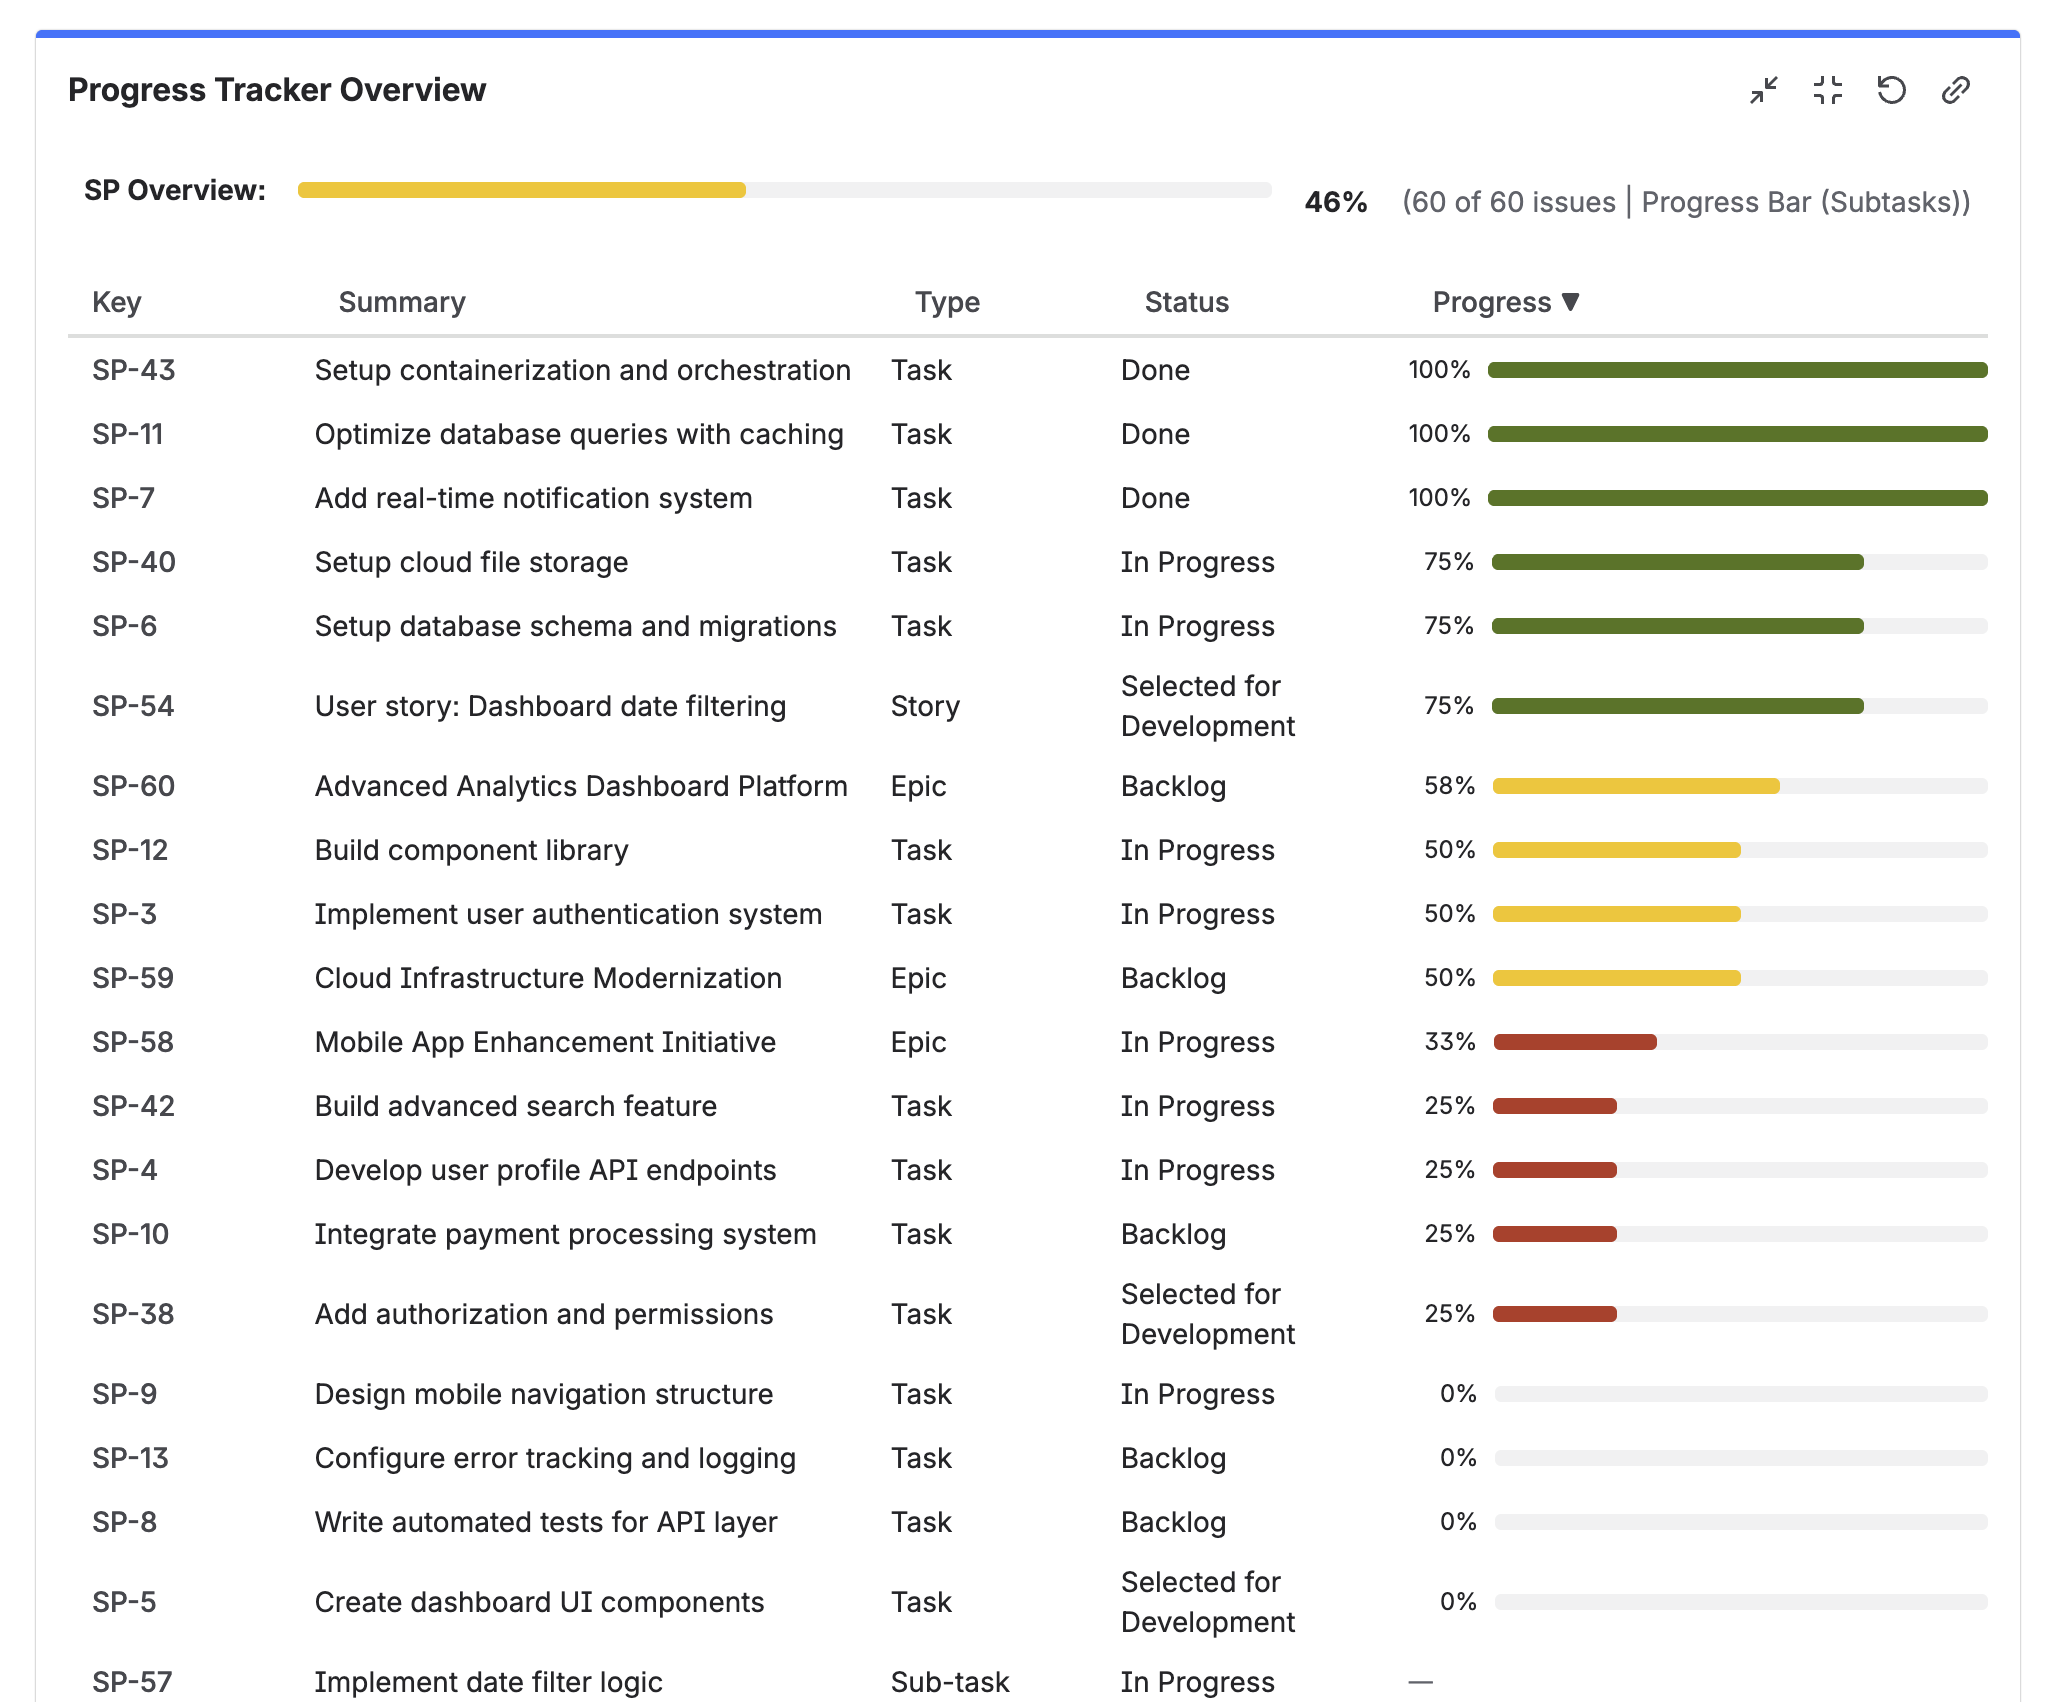
The Progress Tracker Overview gadget on a Jira Dashboard — sprint average at top, all issues listed with color-coded progress bars
Setting it up
-
1Install Visual Progress Tracker from the Atlassian Marketplace. Free trial available, no credit card required.
-
2Create a progress bar field. Go to Jira Settings → Work items → Fields → Create field. Choose "Progress Bar (Status)" for automatic updates based on workflow movement.
-
3Configure status mappings. In App Settings → Status Mapping, assign a percentage to each workflow status — for example: In Progress → 50%, In Review → 75%, Done → 100%. A default mapping is pre-loaded as a starting point.
-
4Add the field to your project screen. Go to Project Settings → Screens → Edit screen and add the progress field. The bar now appears on every issue.
-
5Add the field as a list view column. In any Jira list view or backlog, click the column header area and add the progress bar field.
-
6Add the gadget to a Jira Dashboard. Click Add gadget, search for "Progress Tracker Overview", select your project, and optionally enter
sprint in openSprints()as the JQL filter to scope it to the active sprint.
That's the full setup. Once configured, the progress bars update automatically on every status change — no manual maintenance needed.
Frequently asked questions
What does sprint health mean in Jira?
Sprint health describes how likely a sprint is to complete its committed work on time. Key signals include whether in-progress items are genuinely advancing, whether any items appear stuck, and whether the overall completion rate is on track. Jira's default sprint board shows status but not progress, which makes sprint health assessment difficult without additional tooling.
How do I see sprint progress in Jira?
Add a progress bar custom field via an app like Visual Progress Tracker for Jira, then add it as a list view column. Use the dashboard gadget with the JQL filter sprint in openSprints() to see all sprint issues and an average completion percentage in one view.
Can I filter the dashboard gadget by sprint?
Yes. The Progress Tracker Overview gadget has an optional JQL filter field. Enter sprint in openSprints() to limit the view to your current sprint's issues. The average progress bar at the top then reflects that sprint's overall completion, not the full project's.
Does Jira have a built-in sprint health dashboard?
Jira's built-in Sprint Report shows completed vs remaining story points and a burndown chart, but does not show per-issue progress percentages or a visual completion indicator per ticket. An app that adds progress bar custom fields and a dashboard gadget fills that gap.
What is the difference between a sprint health dashboard and Jira's Sprint Report?
The Sprint Report focuses on story points — how many were completed and how many remain. A sprint health dashboard focuses on progress at the issue level: how far along each ticket actually is, which ones are at risk, and what the average completion looks like across the sprint. Both views are useful and complement each other.
See your sprint health in minutes
Visual Progress Tracker adds color-coded progress to every Jira issue — and a dashboard gadget that gives you the full sprint picture at a glance. Free trial, no credit card required.
Try it free on Marketplace →