Jira Cloud · Forge-native · Dashboard gadget
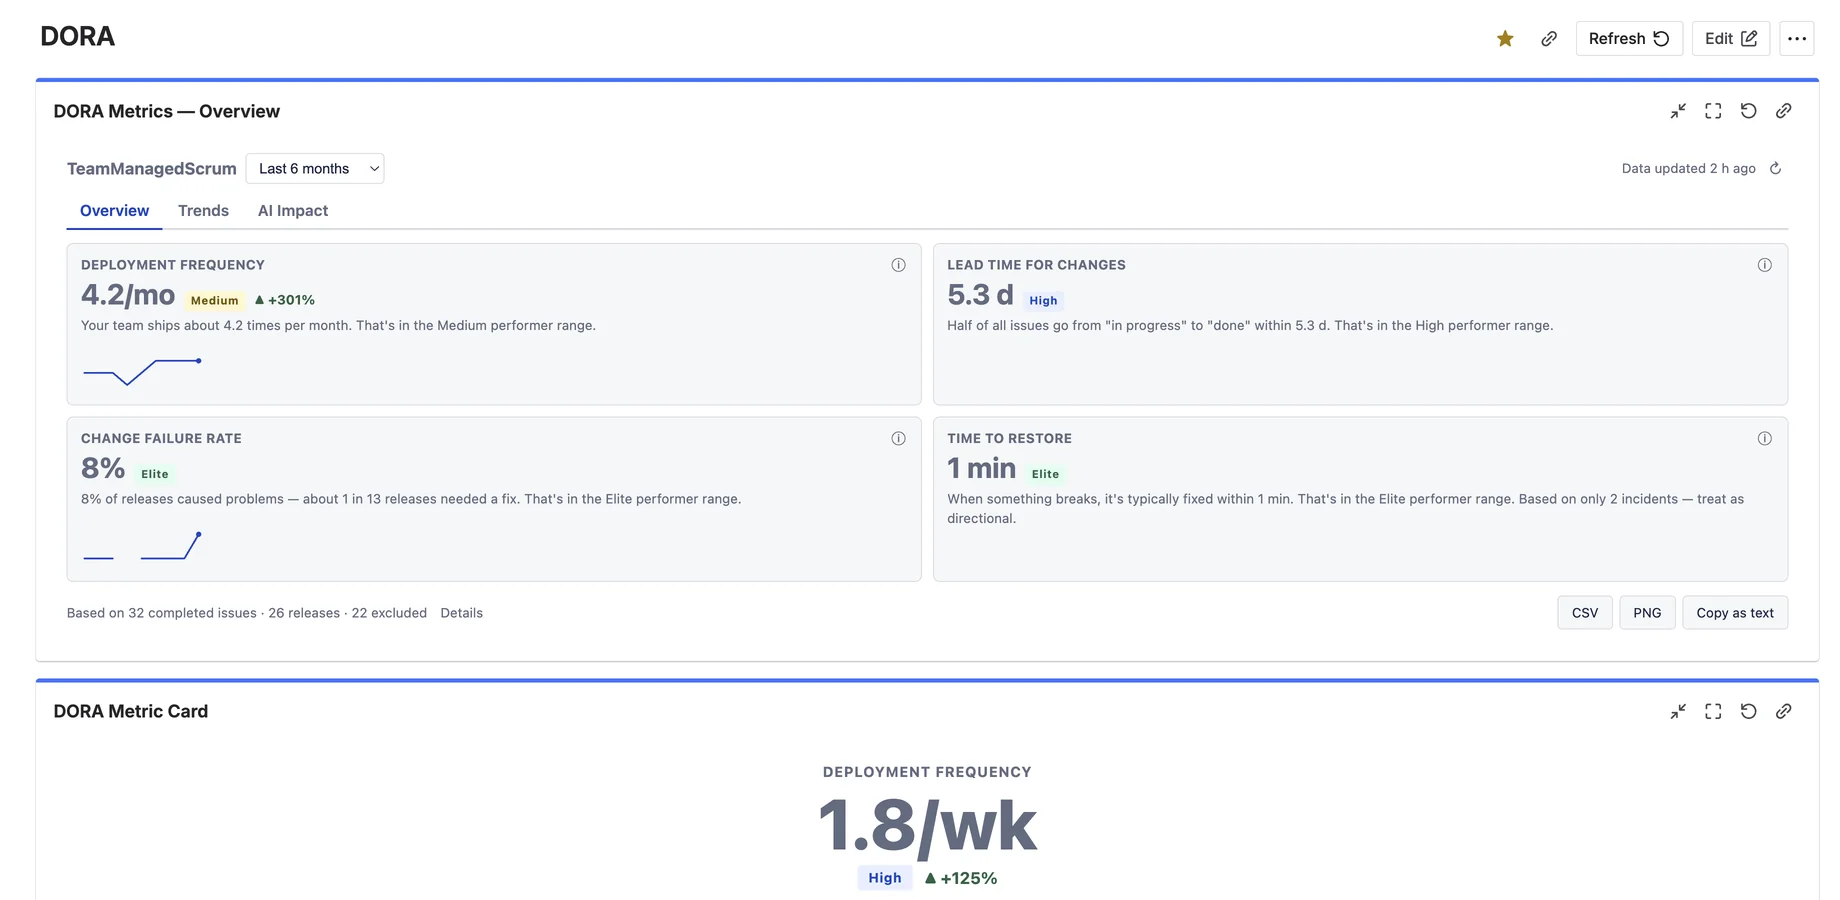
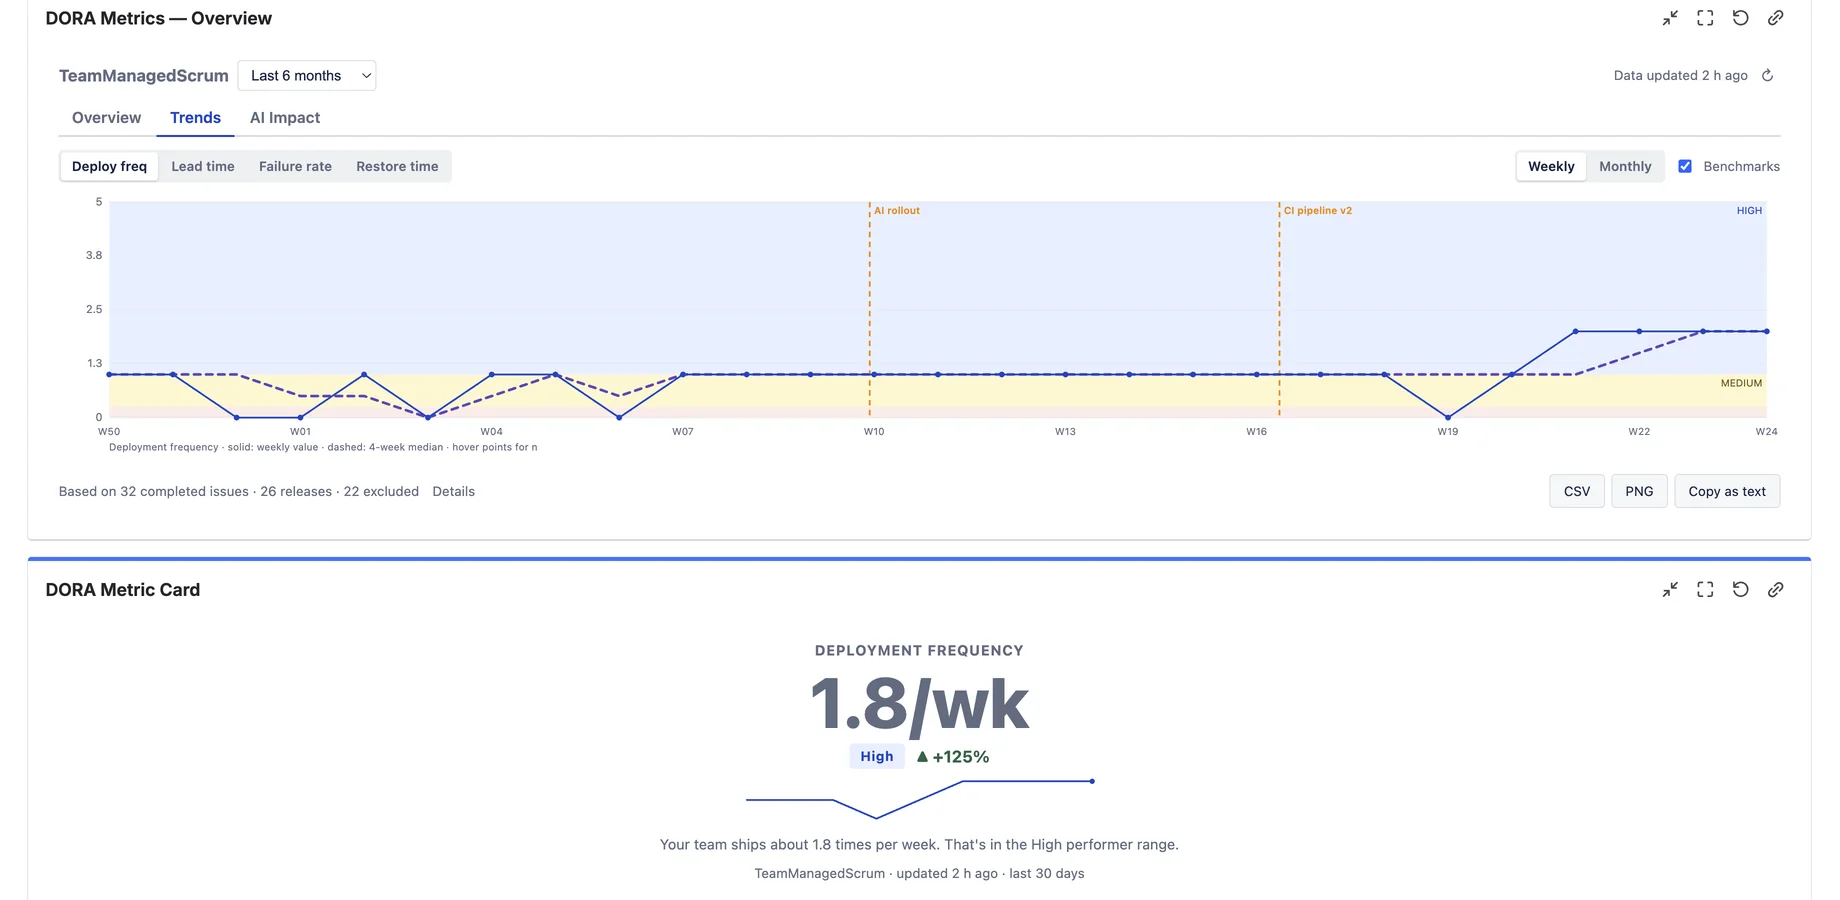
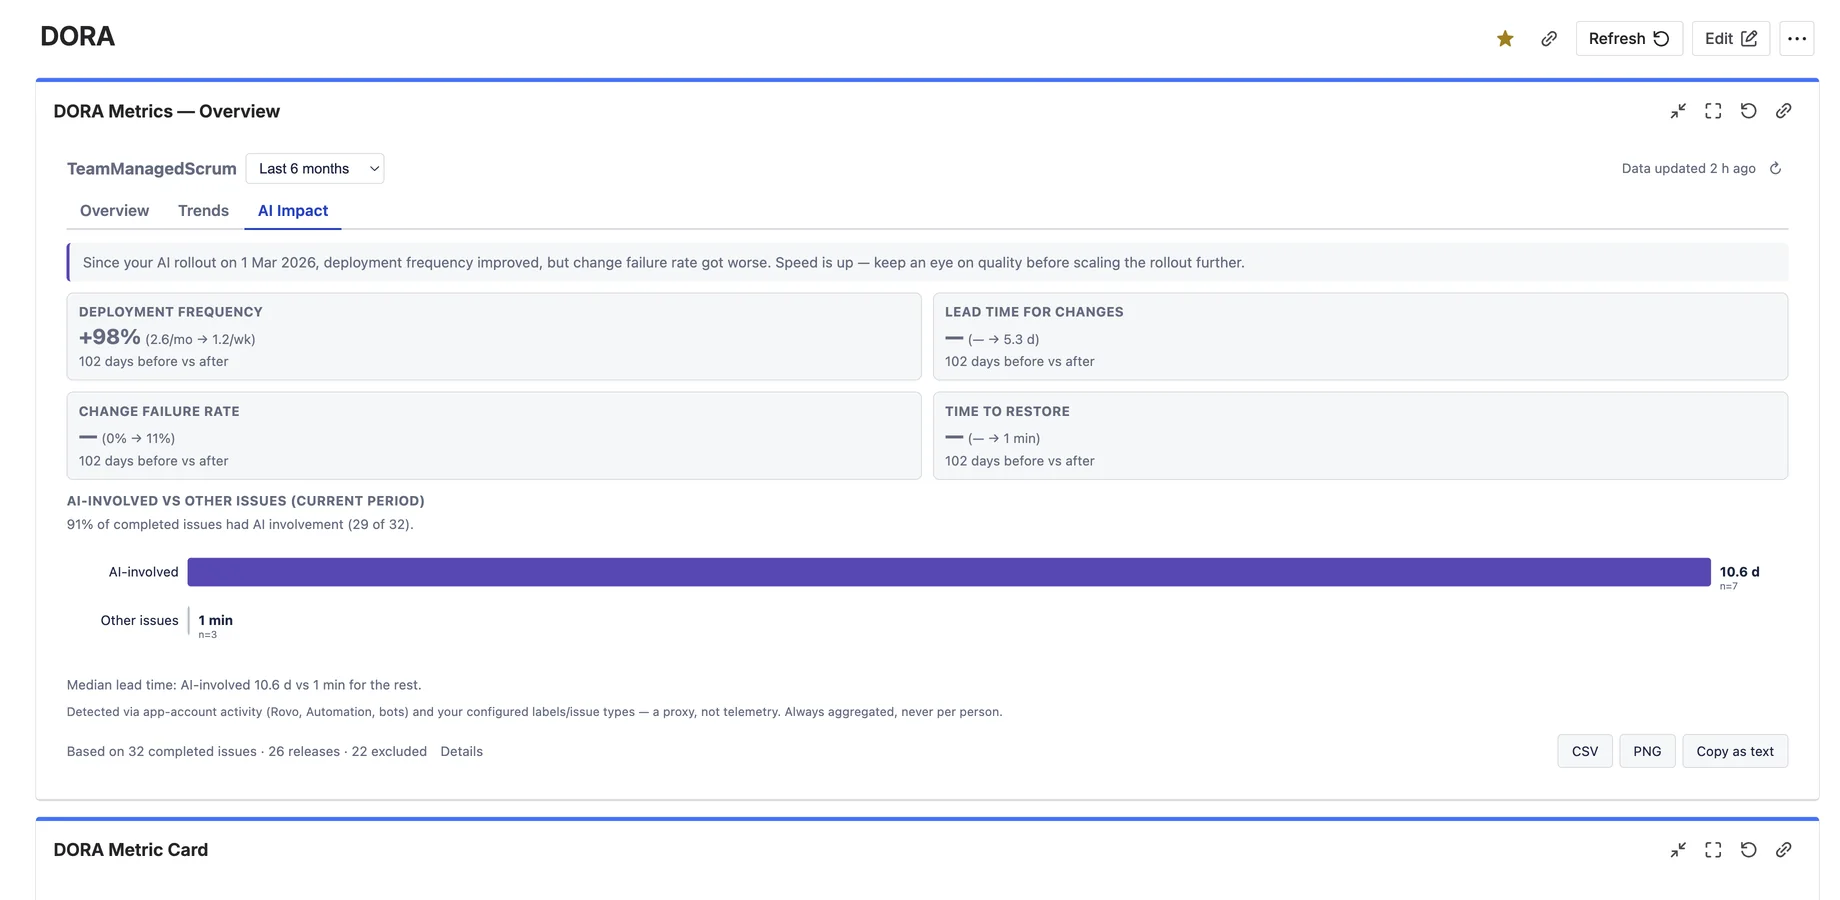
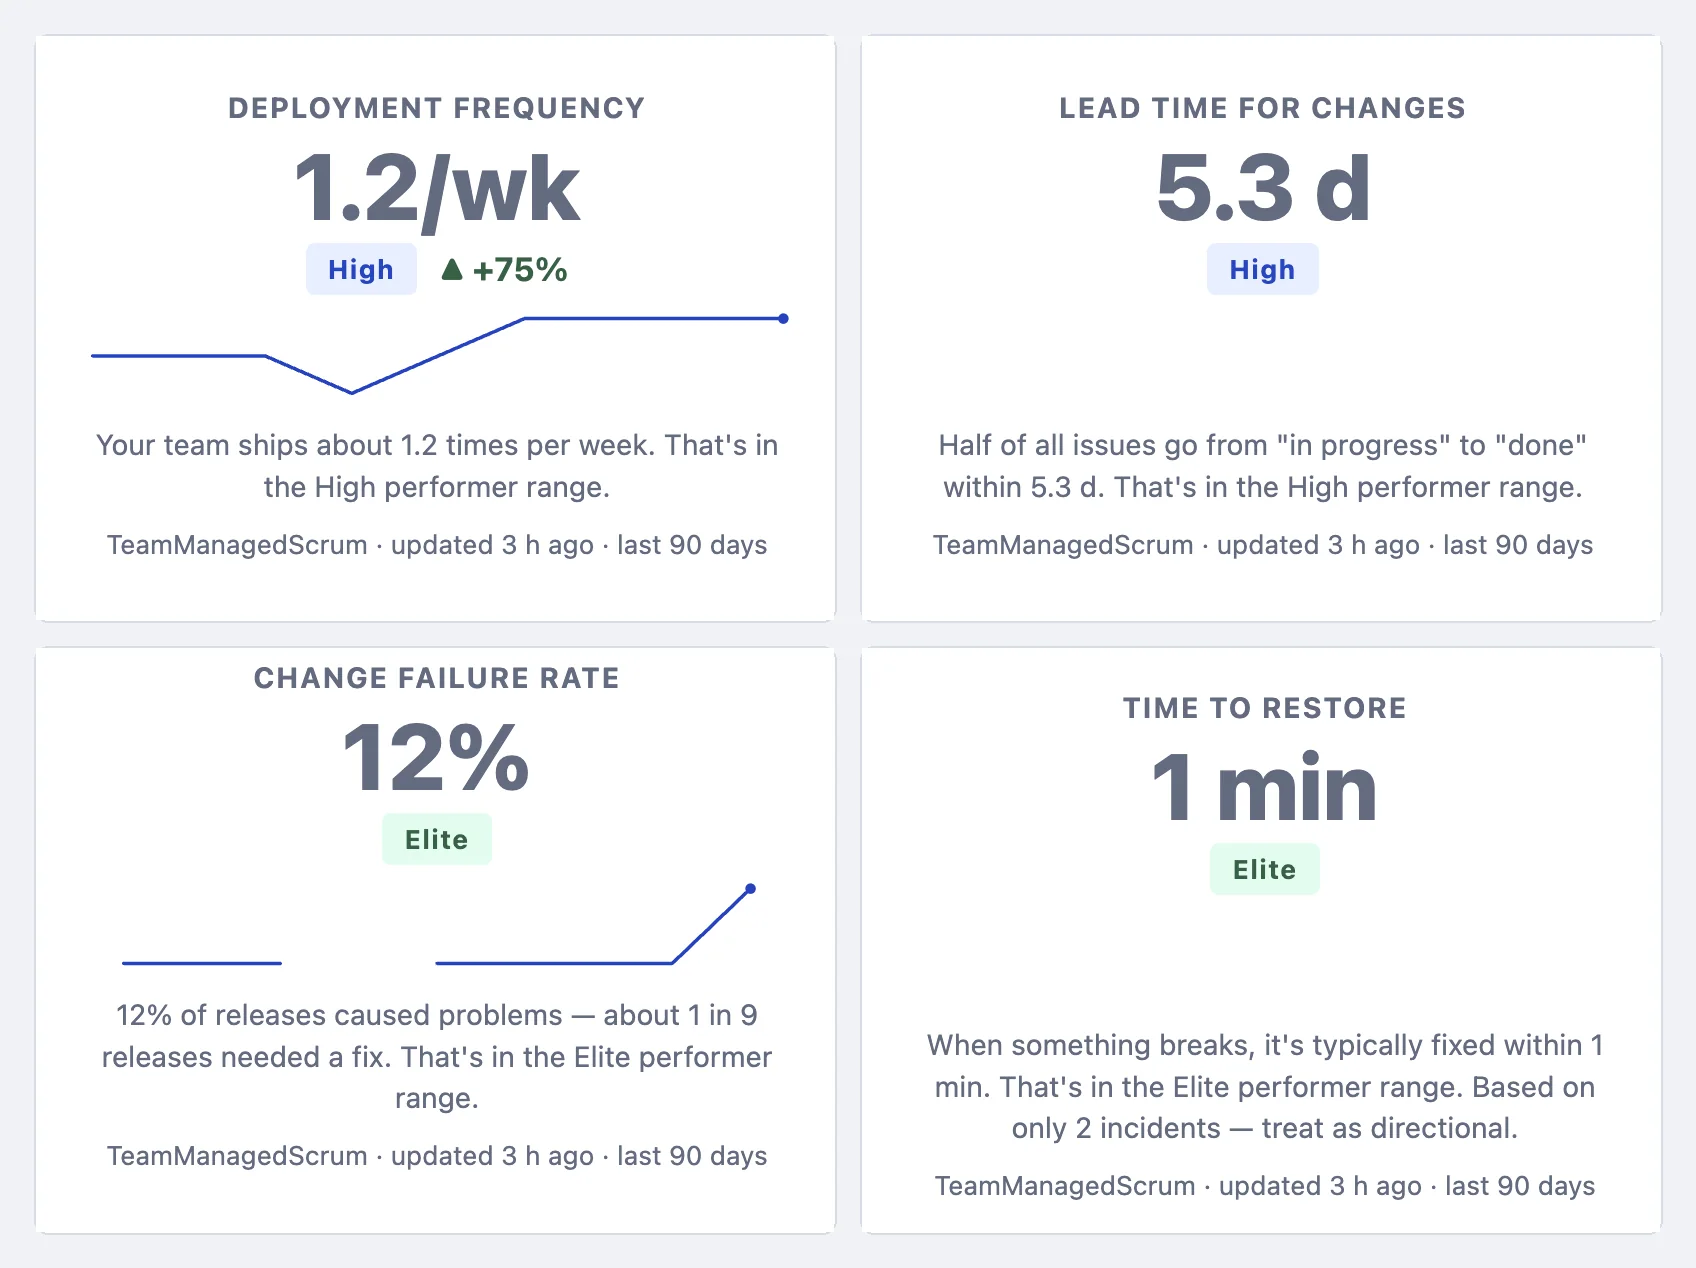
All four DORA™ metrics,
on your Jira dashboard
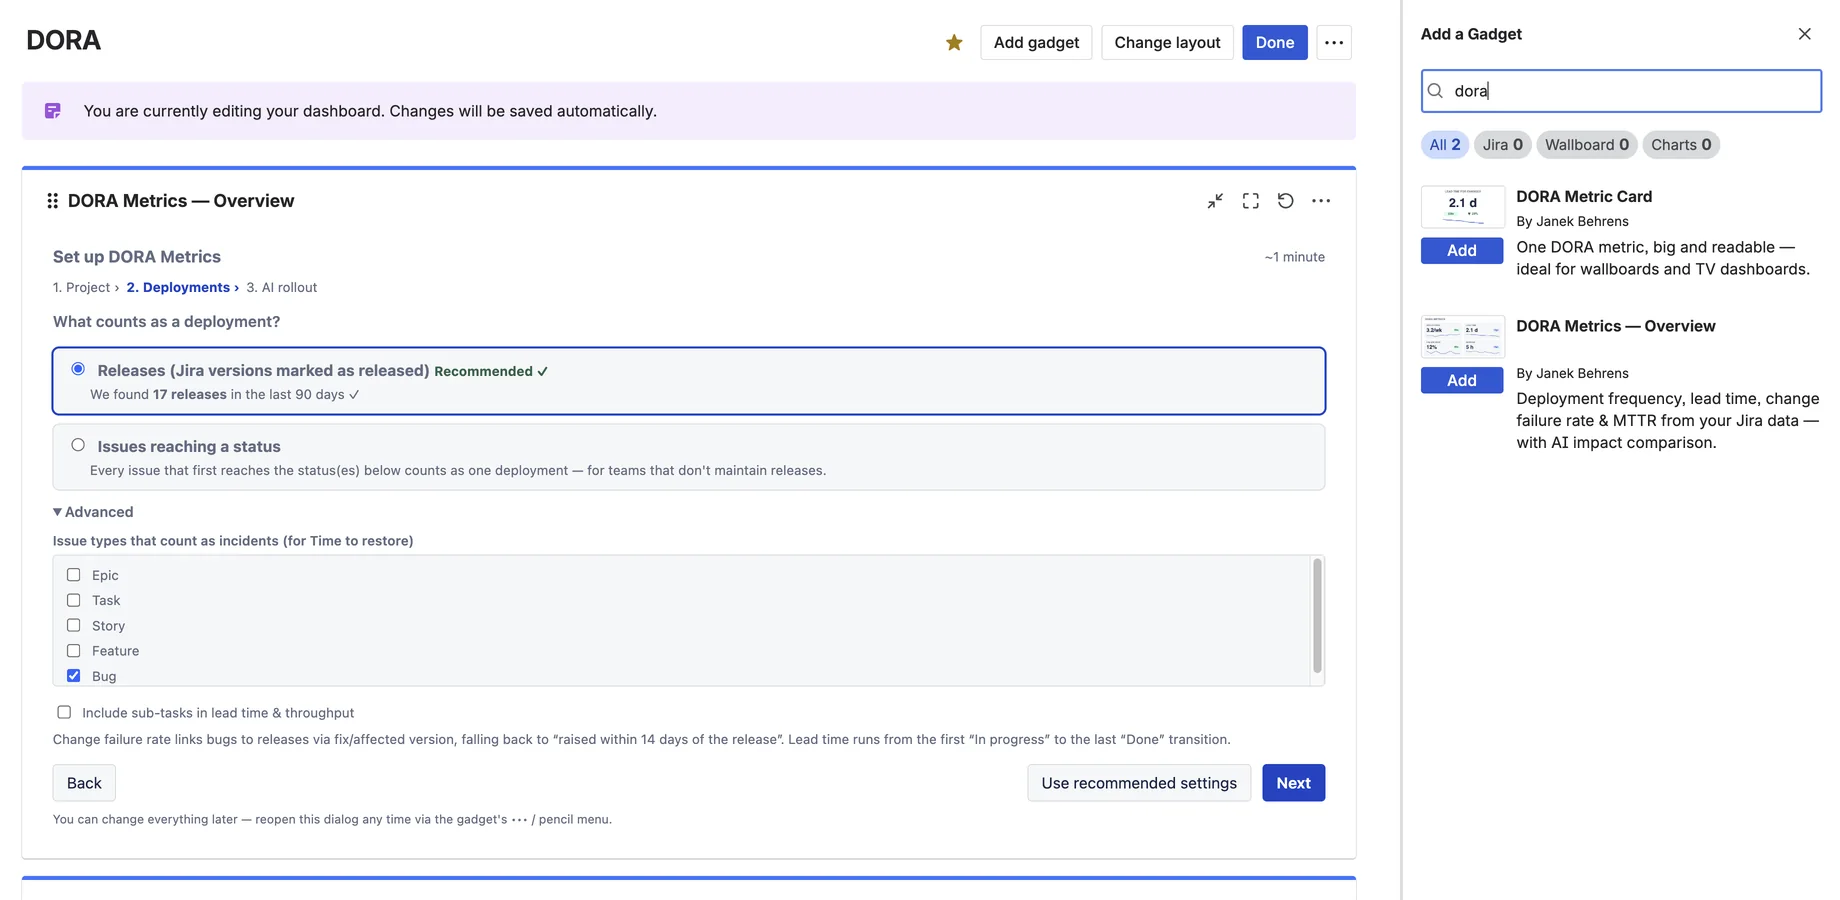
Deployment frequency, lead time, change failure rate and MTTR — calculated from the Jira data you already have. No CI/CD setup, no second product, no spreadsheet.
Free for up to 10 users · Benchmark bands included · Read-only, runs on Atlassian