All apps
Velocity Chart for Jira icon
Jira Cloud · Forge-native · Dashboard gadget

Your real sprint velocity,
on any dashboard

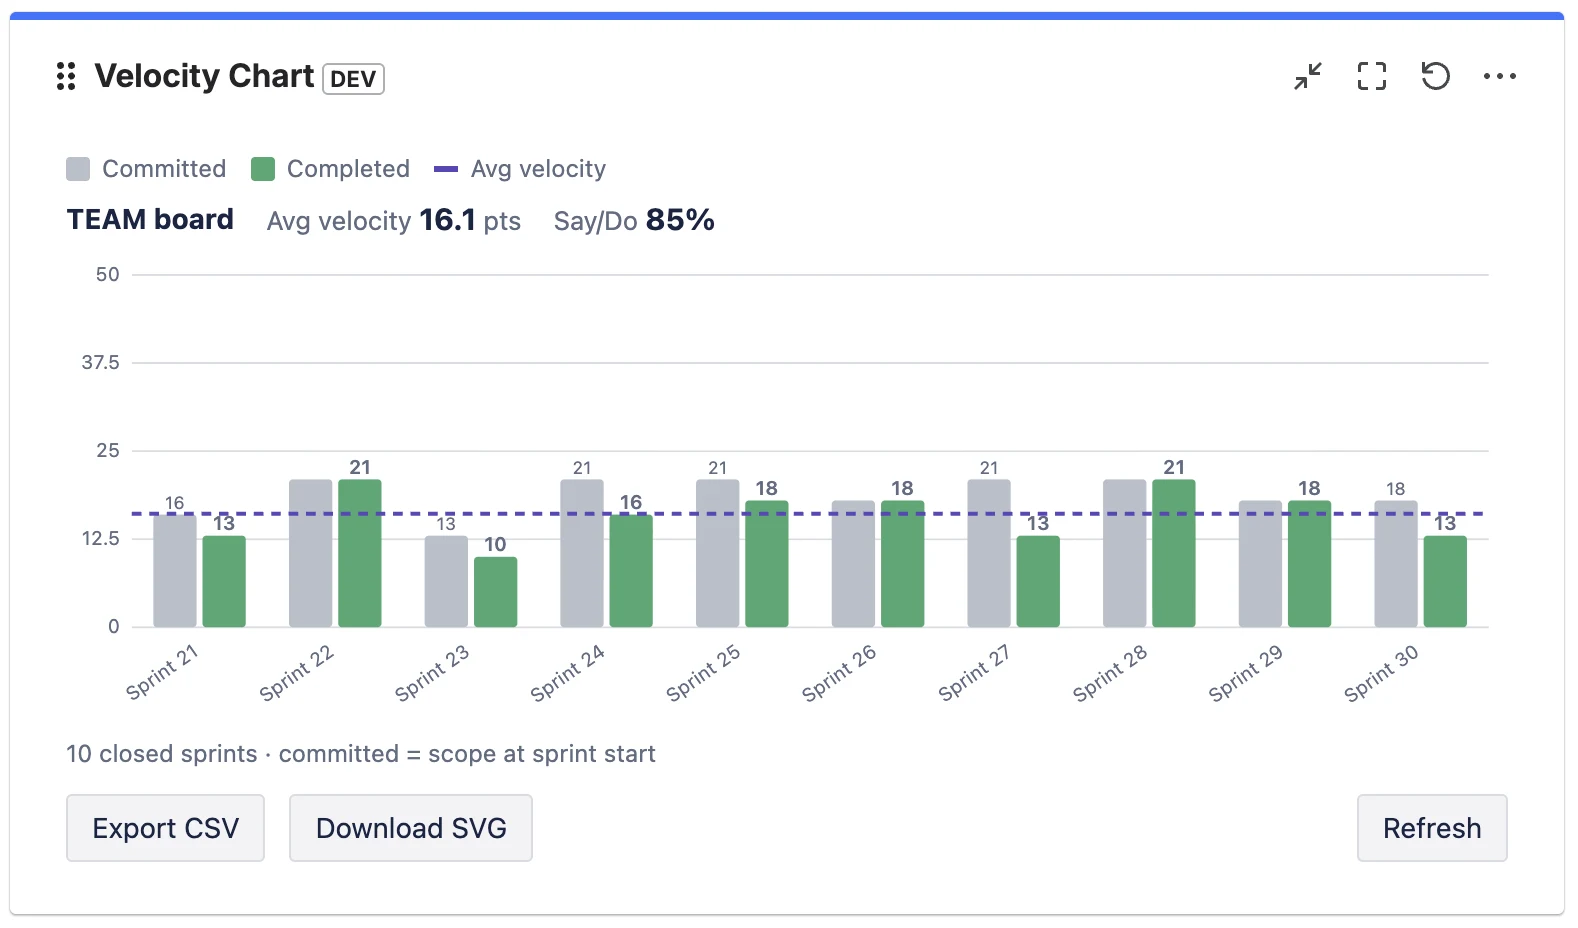
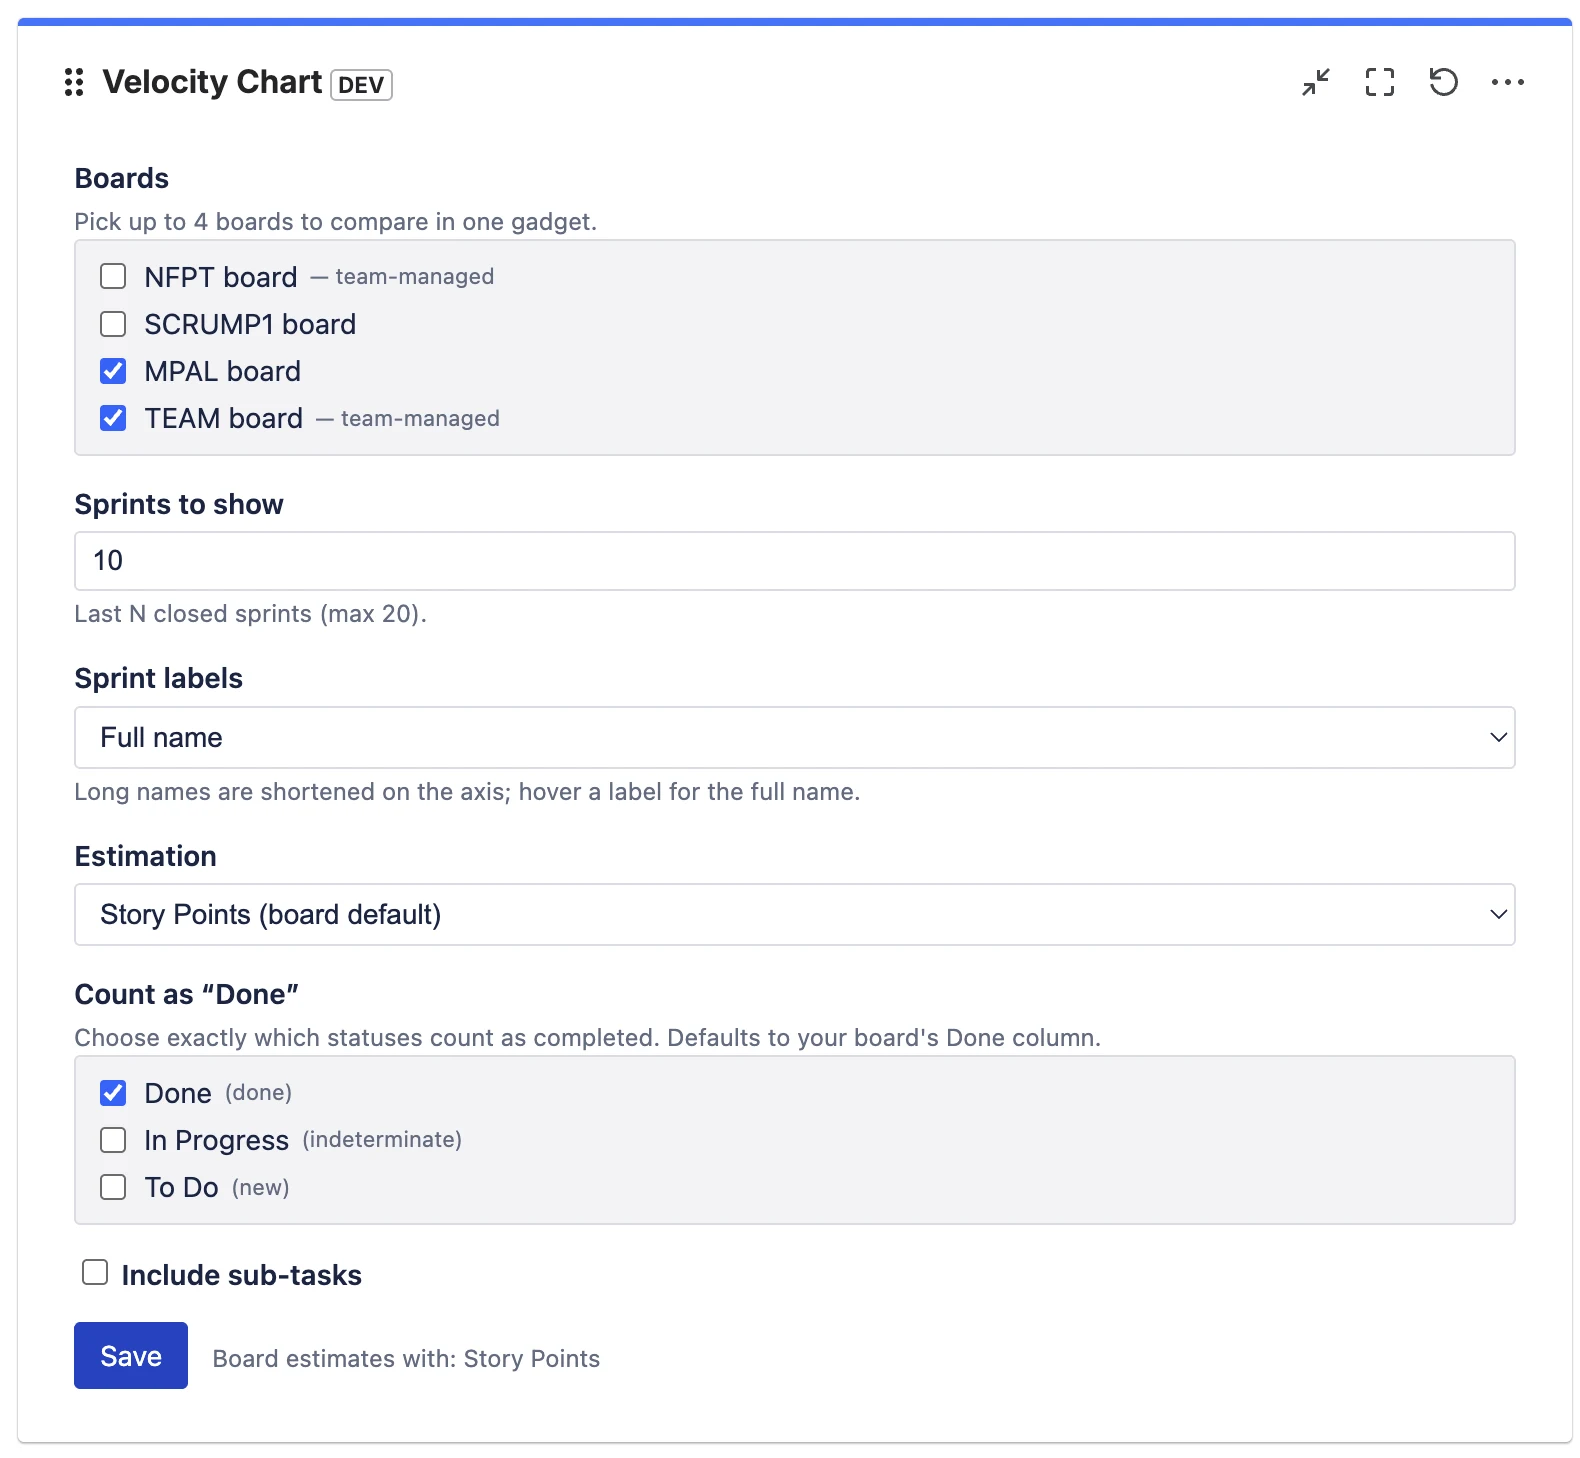
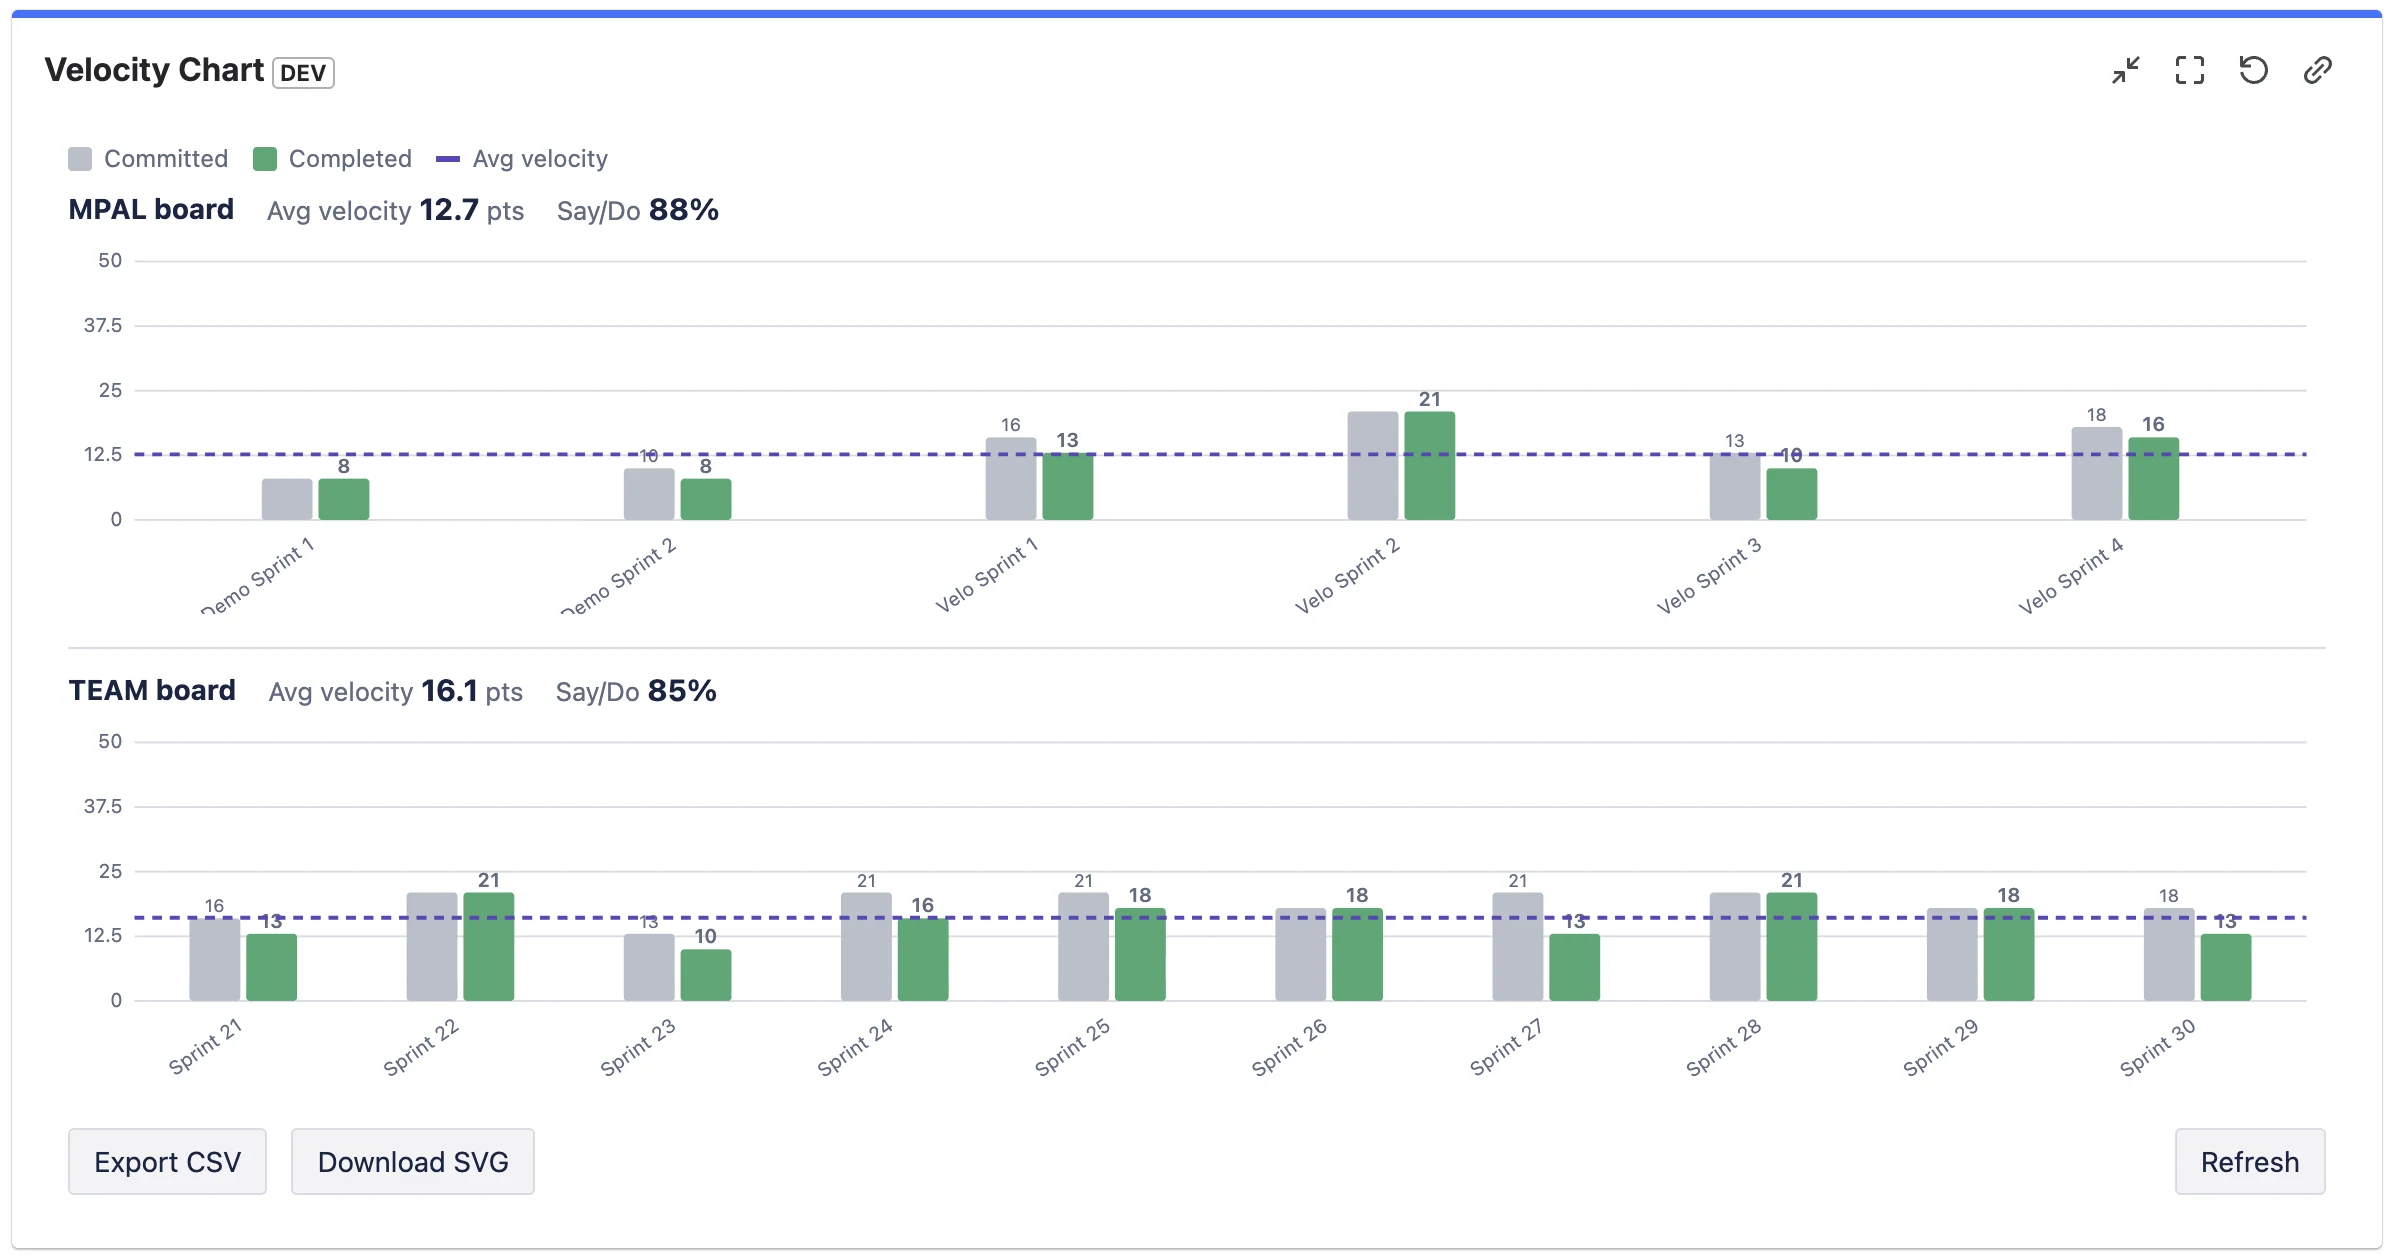
Committed vs completed with an average-velocity line — on every Scrum board, with your own Definition of Done. The velocity chart the native report keeps locked away on the board.

Free for up to 10 users · Company- & team-managed boards · Read-only, runs on Atlassian

Atlassian Marketplace Partner
Company- & team-managed Scrum
Read-only · No data leaves Atlassian
Free for up to 10 users
Velocity Chart gadget showing committed (grey) vs completed (green) bars for ten sprints, a dashed average-velocity line at 16.1 points, and an 85% say/do ratio

Committed vs completed for your last sprints, with the average-velocity line and say/do — on a dashboard, not buried on the board.

Why Jira's built-in velocity report isn't enough

Native velocity report Velocity Chart for Jira
Hidden in a single board's Reports — no native dashboard view Dashboard gadget, right next to your other gadgets
One board per report Compare up to 4 boards in one gadget PRO
“Done” = the board's fixed column mapping Configurable Definition of Done PRO
Estimation = the board's saved setting Story Points, issue count, or any numeric field PRO
Sub-tasks always excluded Sub-task inclusion is an option PRO
No predictability number Say/do ratio per sprint and on average PRO
No built-in export CSV & SVG export PRO

Jira's velocity report is genuinely useful — but it lives inside one board's Reports section, reads only that board's filter and column mapping, and leaves out sub-tasks. Velocity Chart keeps the same committed-vs-completed idea and puts it where you actually watch your sprint: the dashboard. See how velocity is calculated →

Count exactly the work your team calls “done”

The native report counts only your board's last column. But plenty of teams have Released, QA Passed, or Accepted statuses that really mean done — and they get left out, quietly under-reporting every sprint.

Velocity Chart lets you pick the exact statuses that count as completed, so your velocity reflects how your team actually works.

  • Choose any combination of statuses as “Done” PRO
  • Defaults to your board's Done column — no setup needed to start
  • Estimate by Story Points, issue count, or a custom numeric field PRO
  • Include or exclude sub-tasks PRO
Velocity Chart configuration form: a board picker with team-managed tags, sprints-to-show, estimation mode, and checkboxes to choose which statuses count as Done

Built for how real teams run Scrum

Every board type

Company-managed and team-managed Scrum boards, side by side in the same picker. Team-managed boards are tagged so you always know what you're charting.

Average velocity

A dashed average-velocity line across the sprints you're showing, plus the numeric average — the number you actually use to forecast how much the next sprint can hold.

Predictability PRO

The say/do ratio — completed ÷ committed — per sprint and on average, so you can see how reliably the team delivers what it takes on, not just how much.

Also included

  • Committed reconstructed from real sprint scope at start
  • Up to 7 sprints (Free) or 20 sprints (Pro)
  • Full-name or numbers-only sprint labels
  • Clean, fast UI with dark-mode support
  • Multiple boards compared in one gadget (Pro)
  • CSV & SVG export for slides and reports (Pro)
Two Scrum boards compared in a single Velocity Chart gadget, each with its own bars, average and say/do, using one shared configuration

Several boards, one shared yardstick

Put up to four Scrum boards in one gadget. Each gets its own compact chart, average and say/do — all using the same Definition of Done and estimation, so you're comparing like for like in a single dashboard slot.

  • Up to 4 boards in one gadget, one configuration
  • Ideal for a program or portfolio dashboard
  • Export every board's numbers to CSV in one click

A note on comparing teams: velocity is relative to each team's own estimation, so use it to spot trends and stabilise a team's own pace — not to rank teams against each other.

On your dashboard in 3 steps

1

Install & add the gadget

Install from the Marketplace, open a Jira dashboard, choose Add gadget and search for Velocity Chart.

2

Pick a board

Select any Scrum board — company- or team-managed — with at least one completed sprint. Save.

3

Tune it to your team

Set your Definition of Done, estimation field and sprint count — or leave the defaults and you're done.

Common questions

The native report lives inside a single board's Reports section — there's no native way to put velocity on a dashboard. It's locked to one board, tied to that board's column mapping and estimation setting, and it excludes sub-tasks. Velocity Chart is a dashboard gadget that works on every Scrum board type, lets you define Done and the estimation field yourself, compares multiple boards, adds a say/do number and exports to CSV and SVG.

Yes — fully. Team-managed Scrum boards appear in the picker tagged “team-managed” and use the same committed-vs-completed calculation as company-managed boards.

No. Velocity Chart is strictly read-only and requests no write permissions. It reads sprint data to draw the chart and caches the computed numbers in Atlassian Forge Storage. Your data never leaves Atlassian — see the Security Policy.

Velocity Chart requires Jira Cloud. It's Forge-native and runs entirely on Atlassian's infrastructure — no Data Center or Server. You need a Scrum board with at least one completed sprint; Kanban boards have no sprints.

It's free for teams of up to 10 users, and larger teams get a free trial. The free experience always draws a real single-board velocity chart with the average line. Pro features — configurable Definition of Done, estimation modes, sub-task control, predictability, multi-board compare, more sprints and export — unlock while your site has an active subscription. See the Marketplace listing for current per-user pricing.

See your velocity where you actually look.

Free for up to 10 users — a real velocity chart on any dashboard, in minutes.