
See who's overloaded before the sprint starts
A dashboard gadget with one color-coded bar per person: sprint load against capacity, from the story points, time or issue count your board already uses.
Free for Jira sites with up to 10 users. Larger sites start with a free trial.
What you get
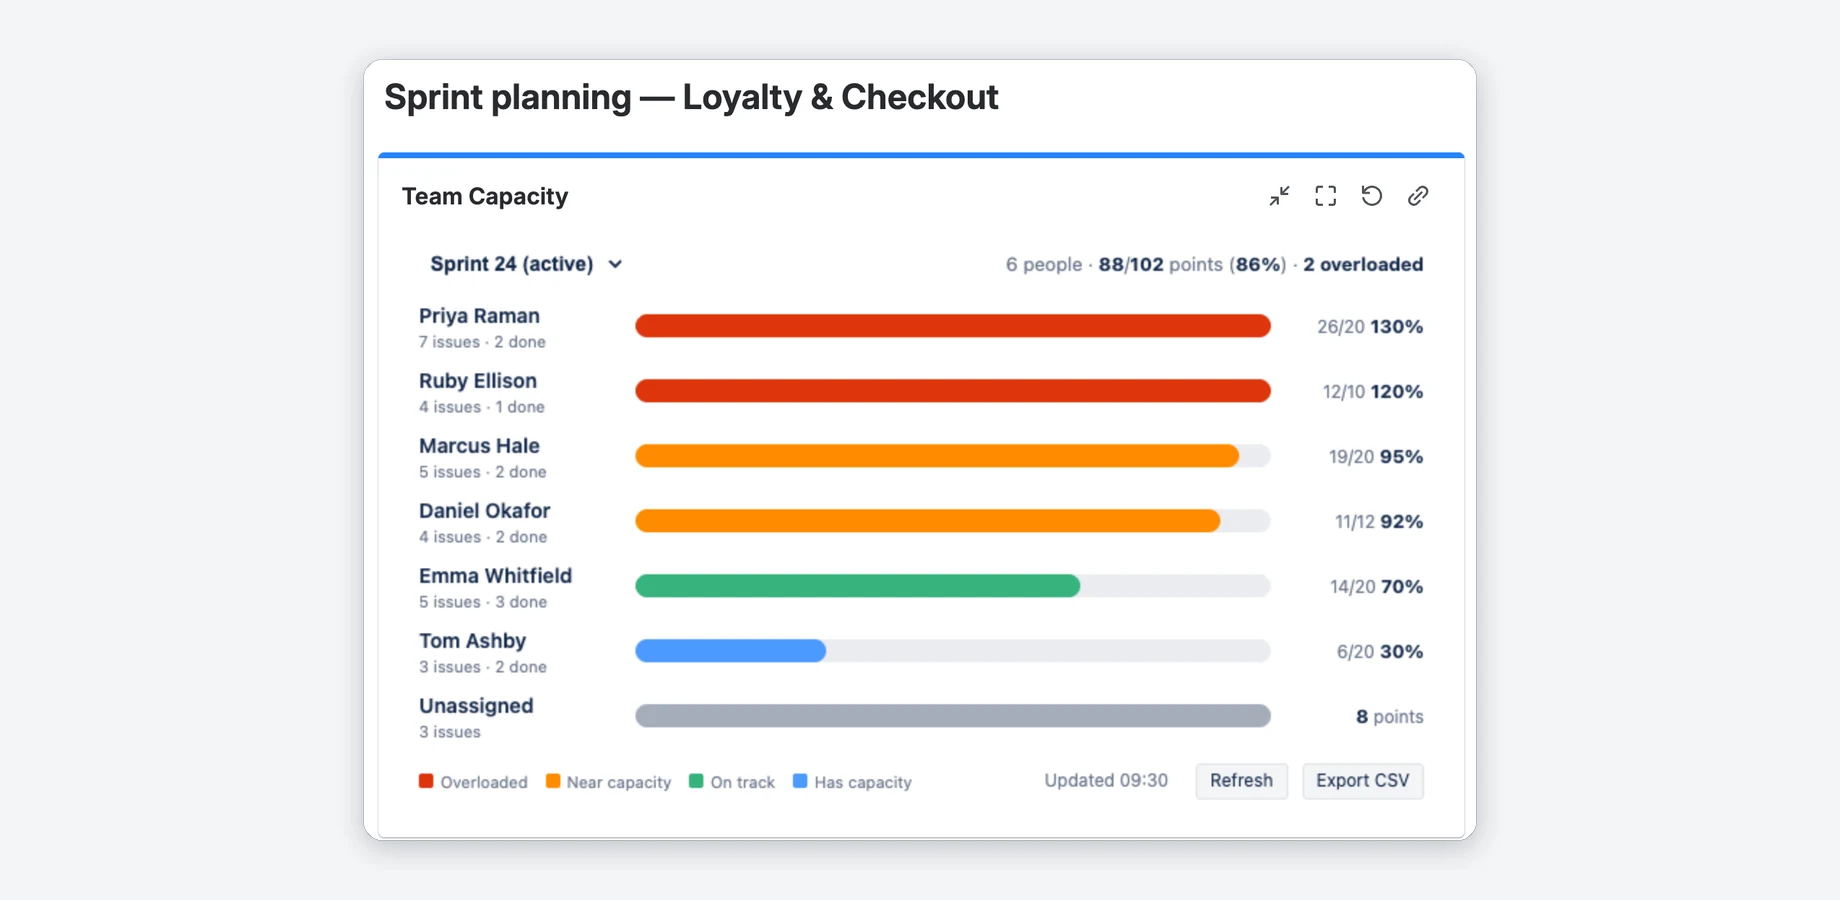
Screenshots from a real Jira site with sample data.
A heatmap for the sprint
One bar per person, highest share of capacity first: red is overloaded, amber near capacity, green on track, blue has room.
- The header shows the team total: people, load against capacity, how many are overloaded.
- Unassigned work gets its own grey row and is not part of the team total.
- Several teams: add the gadget once per board, each with its own sprint and capacity.
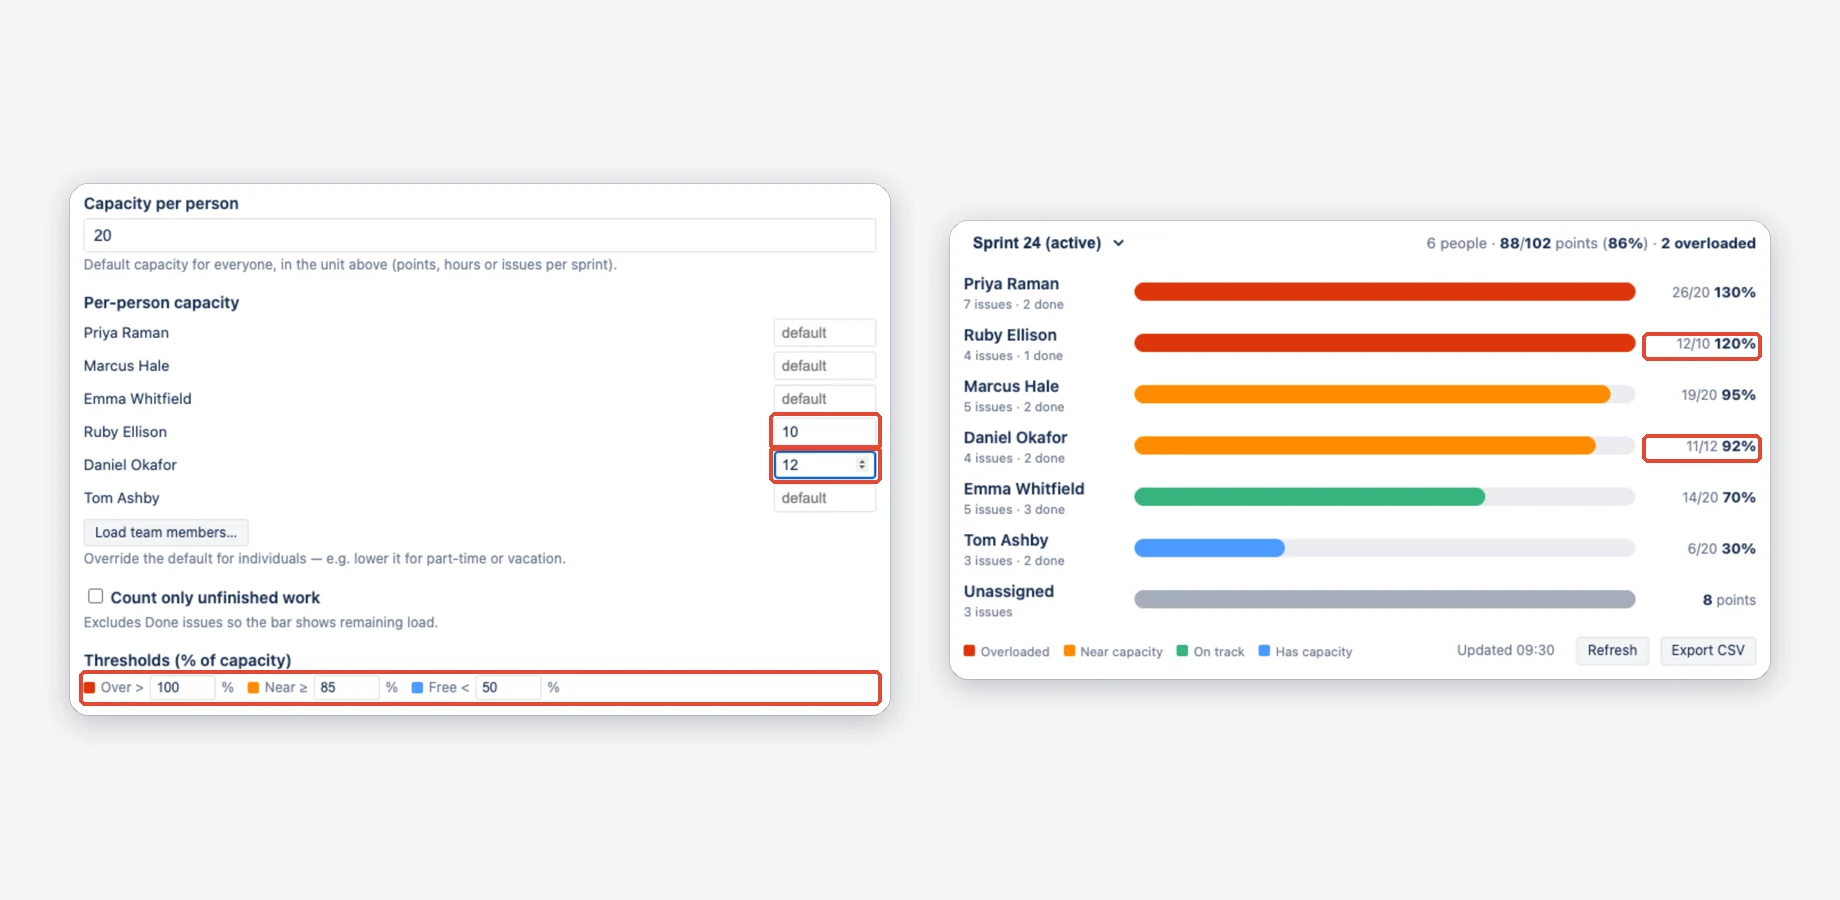
Capacity per person PRO
One default capacity for the team, then individual numbers for part-timers, new joiners or anyone with less time.
- Blank means the default. A person's number applies to every sprint until you change it.
- The app does not read leave or holidays; for time off, enter the lower number yourself.
- Your own thresholds: Over > 100%, Near ≥ 85% and Free < 50% by default.
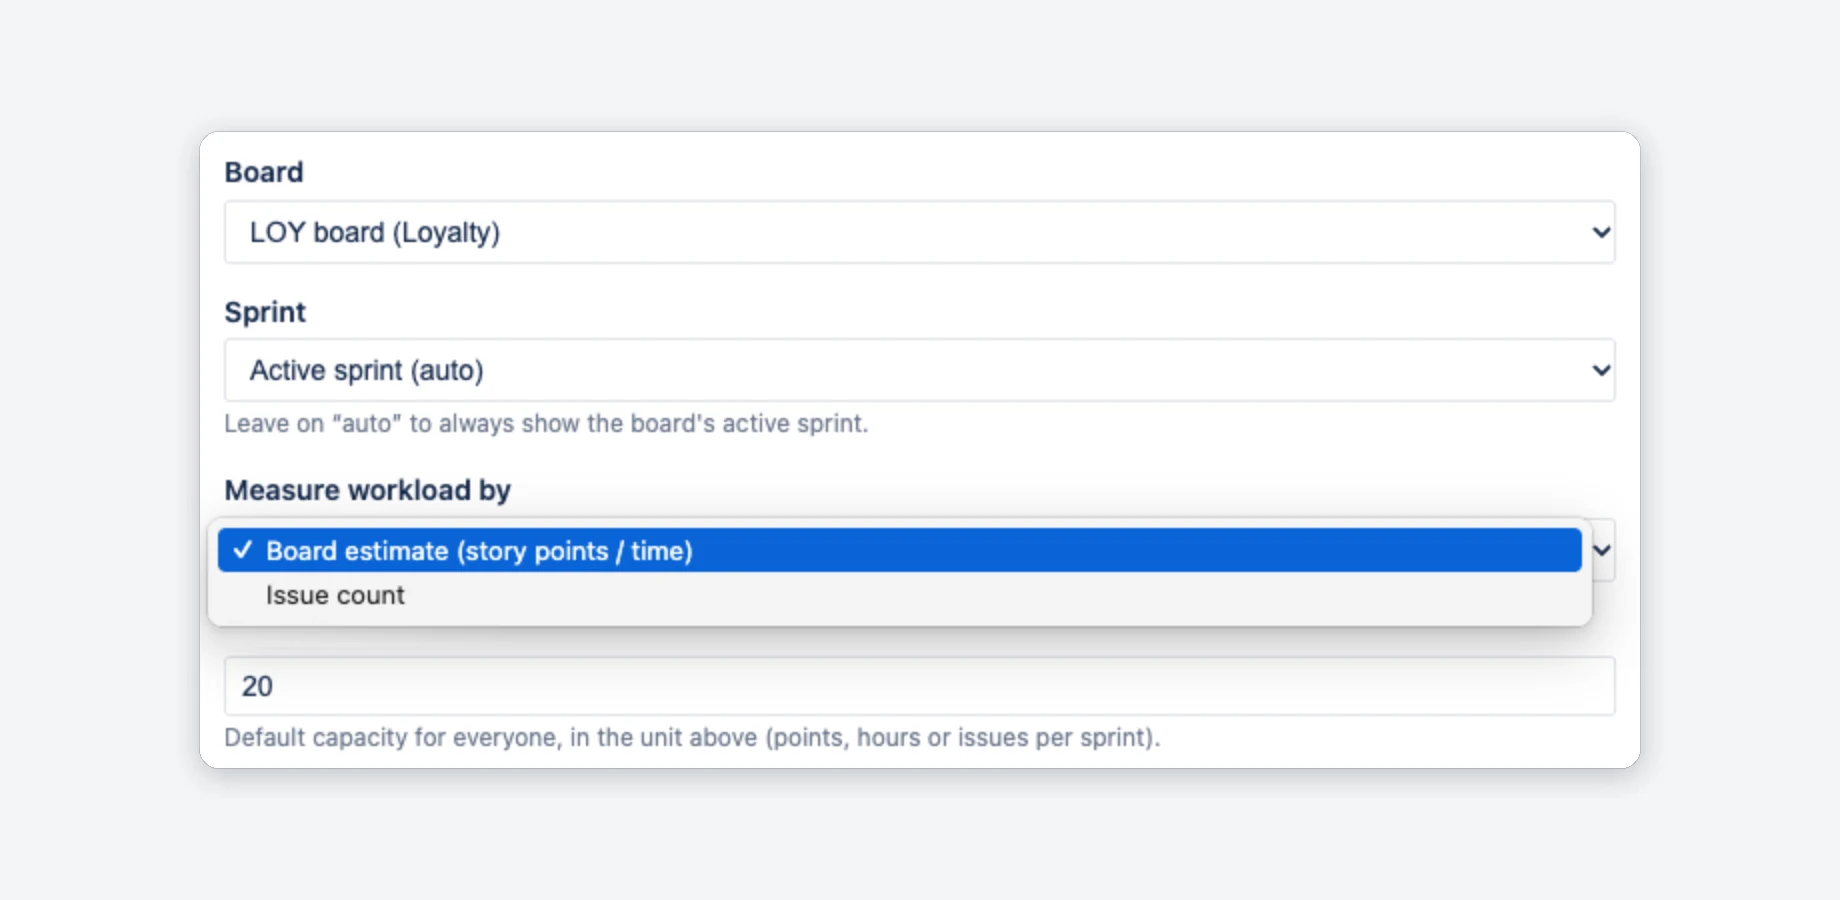
Uses your board's estimates
Workload comes from the estimation your board already has. Nothing to re-enter, nothing to sync.
- Story points: company-managed Story Points and team-managed Story point estimate.
- Time: boards that estimate with Original estimate are counted in hours.
- Issue count for teams that don't estimate. Capacity uses the same unit.
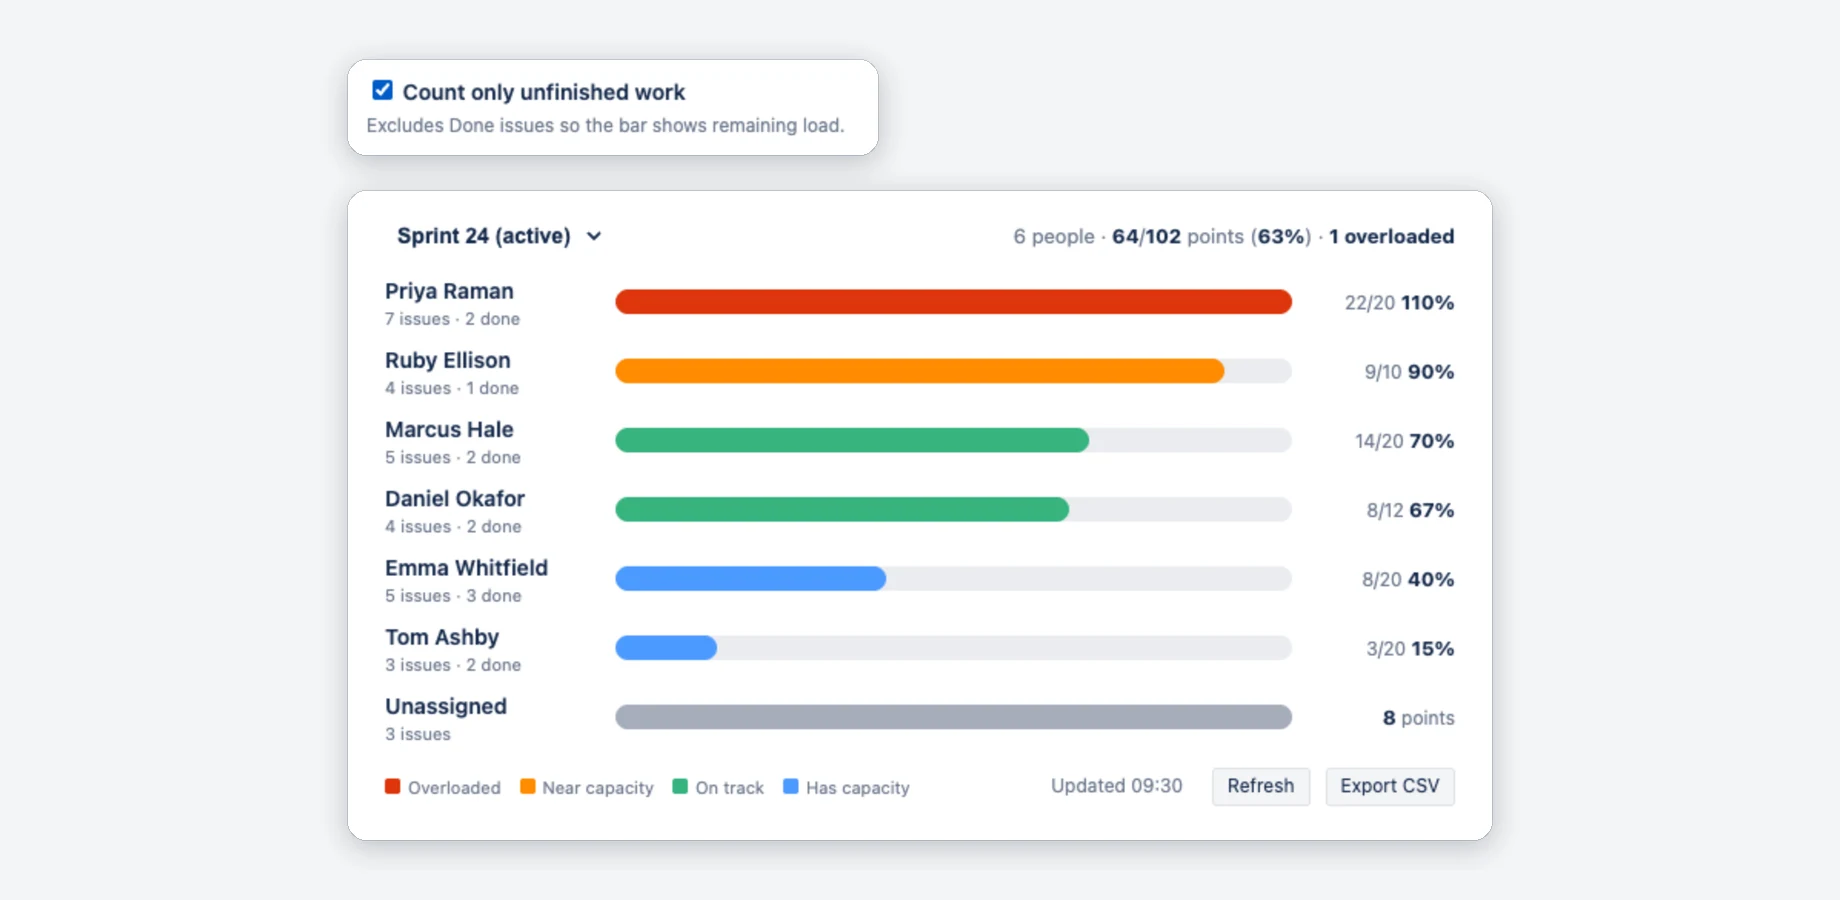
Remaining work mid-sprint PRO
Count only unfinished work leaves Done issues out, so each bar shows the work still open.
- Applies to every bar and to the team total in the header.
- An issue counts as done when its status is in Jira's Done category.
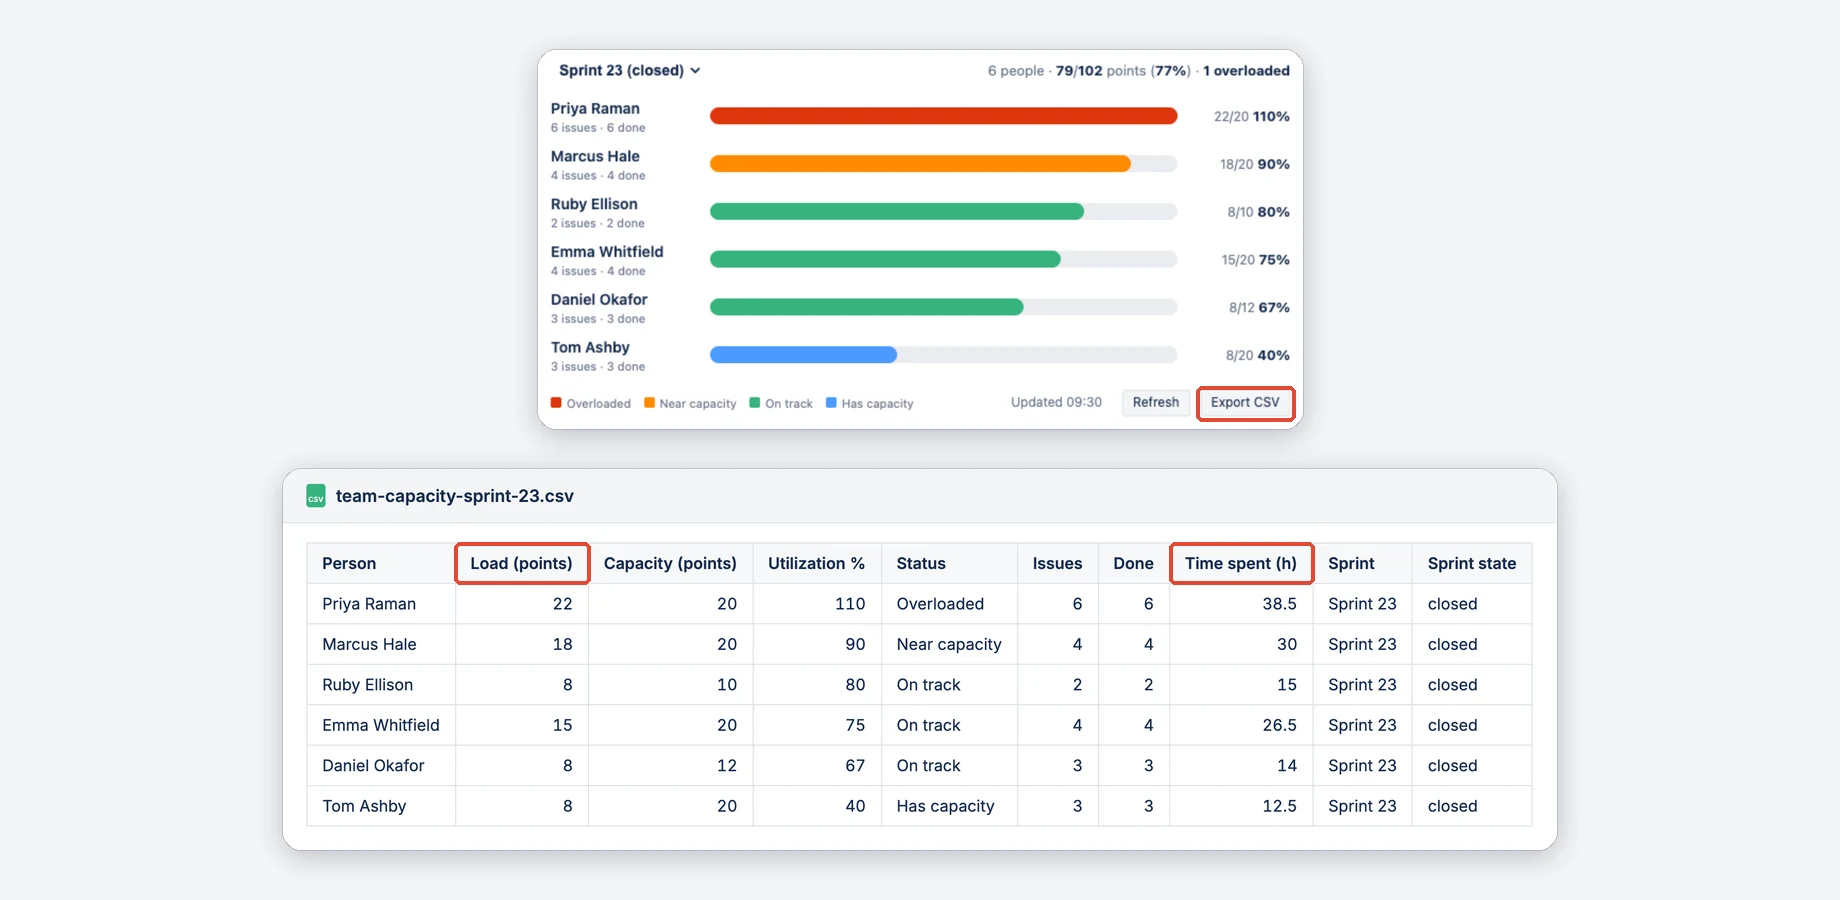
Estimate vs. actual as CSV PRO
Export CSV downloads one row per person for the sprint on screen. It opens in Excel or Google Sheets.
- Load, capacity, utilization %, status, issues, done and time spent in hours.
- For the retro, switch to a closed sprint first: the menu lists the active sprint, upcoming ones and up to eight closed ones.
Watch the tour
A short walkthrough of Team Capacity in Jira.
Jira alone vs. with Team Capacity
| Jira alone | With Team Capacity | |
|---|---|---|
| Workload per person | Gadgets can count issues per assignee, with no capacity to compare them with | Load against each person's capacity, as a red, amber, green or blue bar |
| Planning the next sprint | The backlog shows each sprint's total estimate | Switch to an upcoming sprint and see who would be overloaded |
| Remaining work mid-sprint | The burndown chart shows what is left for the whole sprint | Each person's open load, with Done issues left out (Pro) |
| Estimate vs. actual | Export a search as CSV, one row per issue, and add it up per person yourself | One CSV row per person with load, capacity, status and time spent (Pro) |
Compared with Jira Cloud without apps.
Free and Pro
Free
What the gadget does without an active license.
- The capacity heatmap for company-managed and team-managed Scrum boards
- Workload from the board estimate (story points or time) or issue count
- One default capacity for everyone
- Sprint switch: active, upcoming and up to eight closed sprints
- Refresh, and the time the numbers were read
Pro
No cost on Jira sites with up to 10 users. Larger sites start with a free trial; after the trial it is priced per user.
- Everything in Free
- Capacity per person
- Count only unfinished work
- Your own thresholds for overloaded, near capacity and has capacity
- CSV export with load, capacity, utilization, status and time spent per person
Prices per user are on the Marketplace listing.
Running in three steps
Install
Get the app from the Atlassian Marketplace. A Jira site admin installs it once.
Add the gadget
On a dashboard you can edit, choose Add gadget and search for Team Capacity. No admin rights needed.
Pick a board
In Edit, choose a Scrum board, how to measure workload and a default capacity. Save, and the heatmap appears.
Do we have to re-enter estimates?
Does it work with team-managed projects?
Does it know about vacation or public holidays?
Does the gadget update on its own?
Is it free?
Does any data leave Atlassian?


See who has room this sprint
Free for Jira sites with up to 10 users. Larger sites start with a free trial.