When ICE is the right tool
Not every team has the luxury of user analytics, formal discovery sessions, or reliable reach estimates. Startups, growth teams, and early-stage product squads often face the opposite situation: a long list of ideas, limited time, and no clean data to lean on.
RICE scoring — the more precise cousin — requires you to estimate how many users an idea will reach. If you don't have that number, RICE scores become guesswork dressed up as rigor. ICE skips that question entirely and focuses on what you can usually estimate: how impactful does this feel, how confident are you, and how hard is it to build.
Quick answer: ICE = Impact × Confidence × Ease. All three dimensions scored 1–10. Range: 1–1,000. Higher is better. Jira doesn't include ICE natively — a Marketplace app adds it as a custom field in minutes, and it's the default framework when you first open Priority Scoring for Jira.
The ICE formula
ICE was popularized by Sean Ellis, founder of GrowthHackers, as a rapid scoring method for growth experiments. The formula is deliberately minimal:
Impact — effect on your key metric
Impact is how much this idea will move the number that matters most to your team right now — activation rate, retention, revenue, NPS. Score it 1–10, where 10 means transformational change and 1 means negligible. Be intentional about which metric you're anchoring to — and keep it consistent across the backlog.
Confidence — how sure are you?
Confidence captures how well-supported your Impact estimate is. Score 10 if you have hard data: A/B test results, user interviews, support ticket volume. Score 1–3 if the idea is a hunch with no validation. Most items land in the 5–8 range — you have some signal but haven't tested it. Confidence prevents high-Impact guesses from dominating your roadmap.
Ease — implementation effort inverted
Ease is the inverse of effort. A 10 means a developer could ship it in an hour. A 1 means months of work, high complexity, multiple teams involved. Ease rewards quick wins: a small improvement you can ship this sprint often outranks a large improvement that won't land for a quarter. Unlike RICE's Effort denominator, Ease is just another multiplier — it pulls scores down hard for complex ideas.
The Ease blind spot: Ease scoring can inadvertently bias your backlog toward low-hanging fruit. A team that always picks the easiest 8s will accumulate technical debt and miss high-Impact opportunities that require sustained investment. Use ICE for speed, but revisit the low-Ease, high-Impact ideas regularly — they belong in the roadmap even if they don't top the ICE ranking.
A worked example: 10 ideas, 20 minutes
Imagine a growth team reviewing its idea backlog before quarterly planning. Each team member spends 90 seconds per idea, scores it independently, and the team averages the three dimensions. Here's how five of those ideas shake out:
| Idea | Impact | Confidence | Ease | ICE Score |
|---|---|---|---|---|
| Add progress bar to onboarding checklist | 7 | 8 | 9 | 504 Ship it |
| In-app NPS survey after first export | 5 | 8 | 9 | 360 Ship it |
| Redesign dashboard data visualizations | 8 | 6 | 3 | 144 Later |
| Add SSO support for enterprise accounts | 9 | 7 | 2 | 126 Later |
| Support 12 additional CSV export formats | 3 | 4 | 5 | 60 Question it |
The onboarding progress bar tops the list — not because it's the most impactful idea in isolation, but because it's impactful and easy to build and backed by clear behavioral data. The dashboard redesign (Impact 8) scores low because it's expensive to build. The CSV export idea exposes a backlog zombie — low impact, low confidence, medium effort. It should either be validated or deleted.
ICE vs. RICE: when to graduate
ICE's simplicity is also its constraint. It has no Reach dimension — the framework can't tell you whether an idea affects 10 users or 10,000. Two ideas with identical ICE scores might have very different audience sizes, and ICE will treat them as equals.
That's a fine trade-off when you're moving fast and don't have reach data. But as your product grows, you'll accumulate user analytics, funnel data, and segment reporting. At that point, two things happen:
- You can estimate Reach reliably, so the data is available.
- Reach starts to matter more — a feature that affects your power users (10% of your base) is strategically different from one that affects every new user.
When those conditions are met, switch to RICE scoring. The two frameworks live side by side in Priority Scoring for Jira, so you can run both and compare — or use ICE for early-funnel ideas and RICE for features with known audience sizes.
For teams in SAFe organizations doing PI Planning, neither ICE nor RICE is the right fit — WSJF models the cost of delay and job size that PI planning depends on.
Not sure which framework fits your team? See the full decision guide: RICE vs. WSJF vs. ICE — which Jira prioritization framework is right for you?
How to set up ICE scoring in Jira
The steps below use Priority Scoring for Jira — a Forge-native app that adds RICE, WSJF, and ICE as native custom fields. It runs entirely on Atlassian's infrastructure, so no data leaves your Jira site. ICE is the default framework when you open the app for the first time.
-
1Install Priority Scoring from the Atlassian Marketplace. Search for "Priority Scoring" and install it to your Jira Cloud site. A free trial is available with all features enabled — no credit card required.
-
2Add the ICE Score field to your project screen. Go to Jira Settings → Work Items → Screens, find the screen for your project, and add the "Priority Scoring — ICE" field. The sliders won't appear on issues until this step is complete.
-
3Score your first issue. Open any Jira issue. You'll see three sliders — Impact, Confidence, and Ease — each on a 1–10 scale. Move the sliders and the ICE score updates live above them. It takes under 60 seconds per issue.
-
4Open the Priority Scoring dashboard for the ranked view. Select your project and switch to the ICE framework. All scored issues appear in a sortable table — rank, ICE score with color badge, issue key, summary, sprint, assignee, and due date. Sort descending to see your best bets at the top.
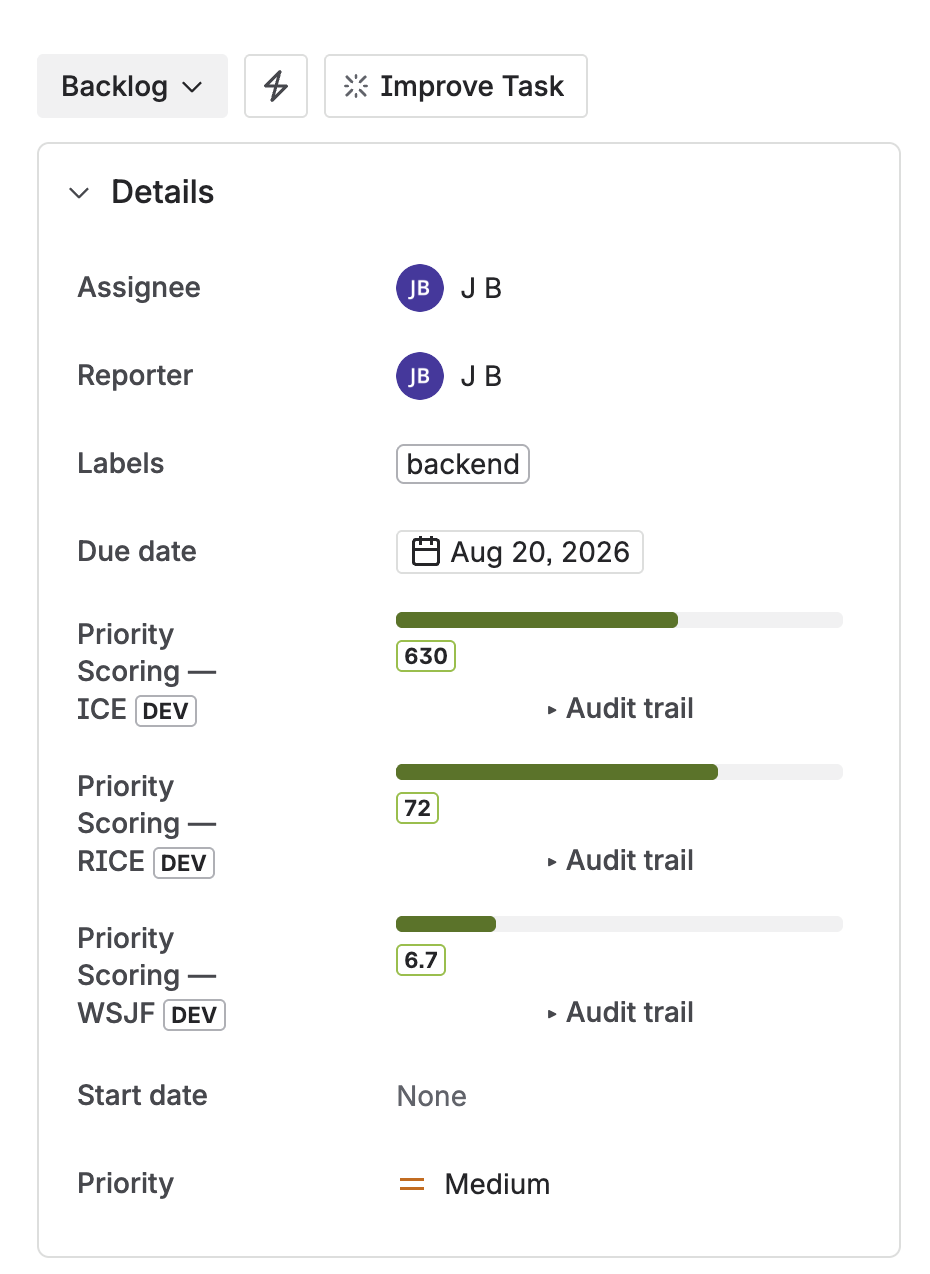
ICE, RICE, and WSJF score fields on a Jira issue — sliders for each dimension, score calculated live
Speed up scoring with Rovo AI
Scoring 50 backlog ideas manually is the biggest adoption barrier for any framework. Priority Scoring includes a Rovo AI Agent that reads issue content and suggests dimension values — Impact, Confidence, and Ease — with written reasoning you can review or override.
For ICE, Rovo is particularly useful in Suggest mode: it gives you a starting point for each dimension and you adjust based on what you know. In practice, most suggestions need one or two tweaks, not a full re-score. For bulk scoring, Rovo in Auto mode can work through an unscored backlog in a single command: "Score all unscored issues in project GROW with ICE."
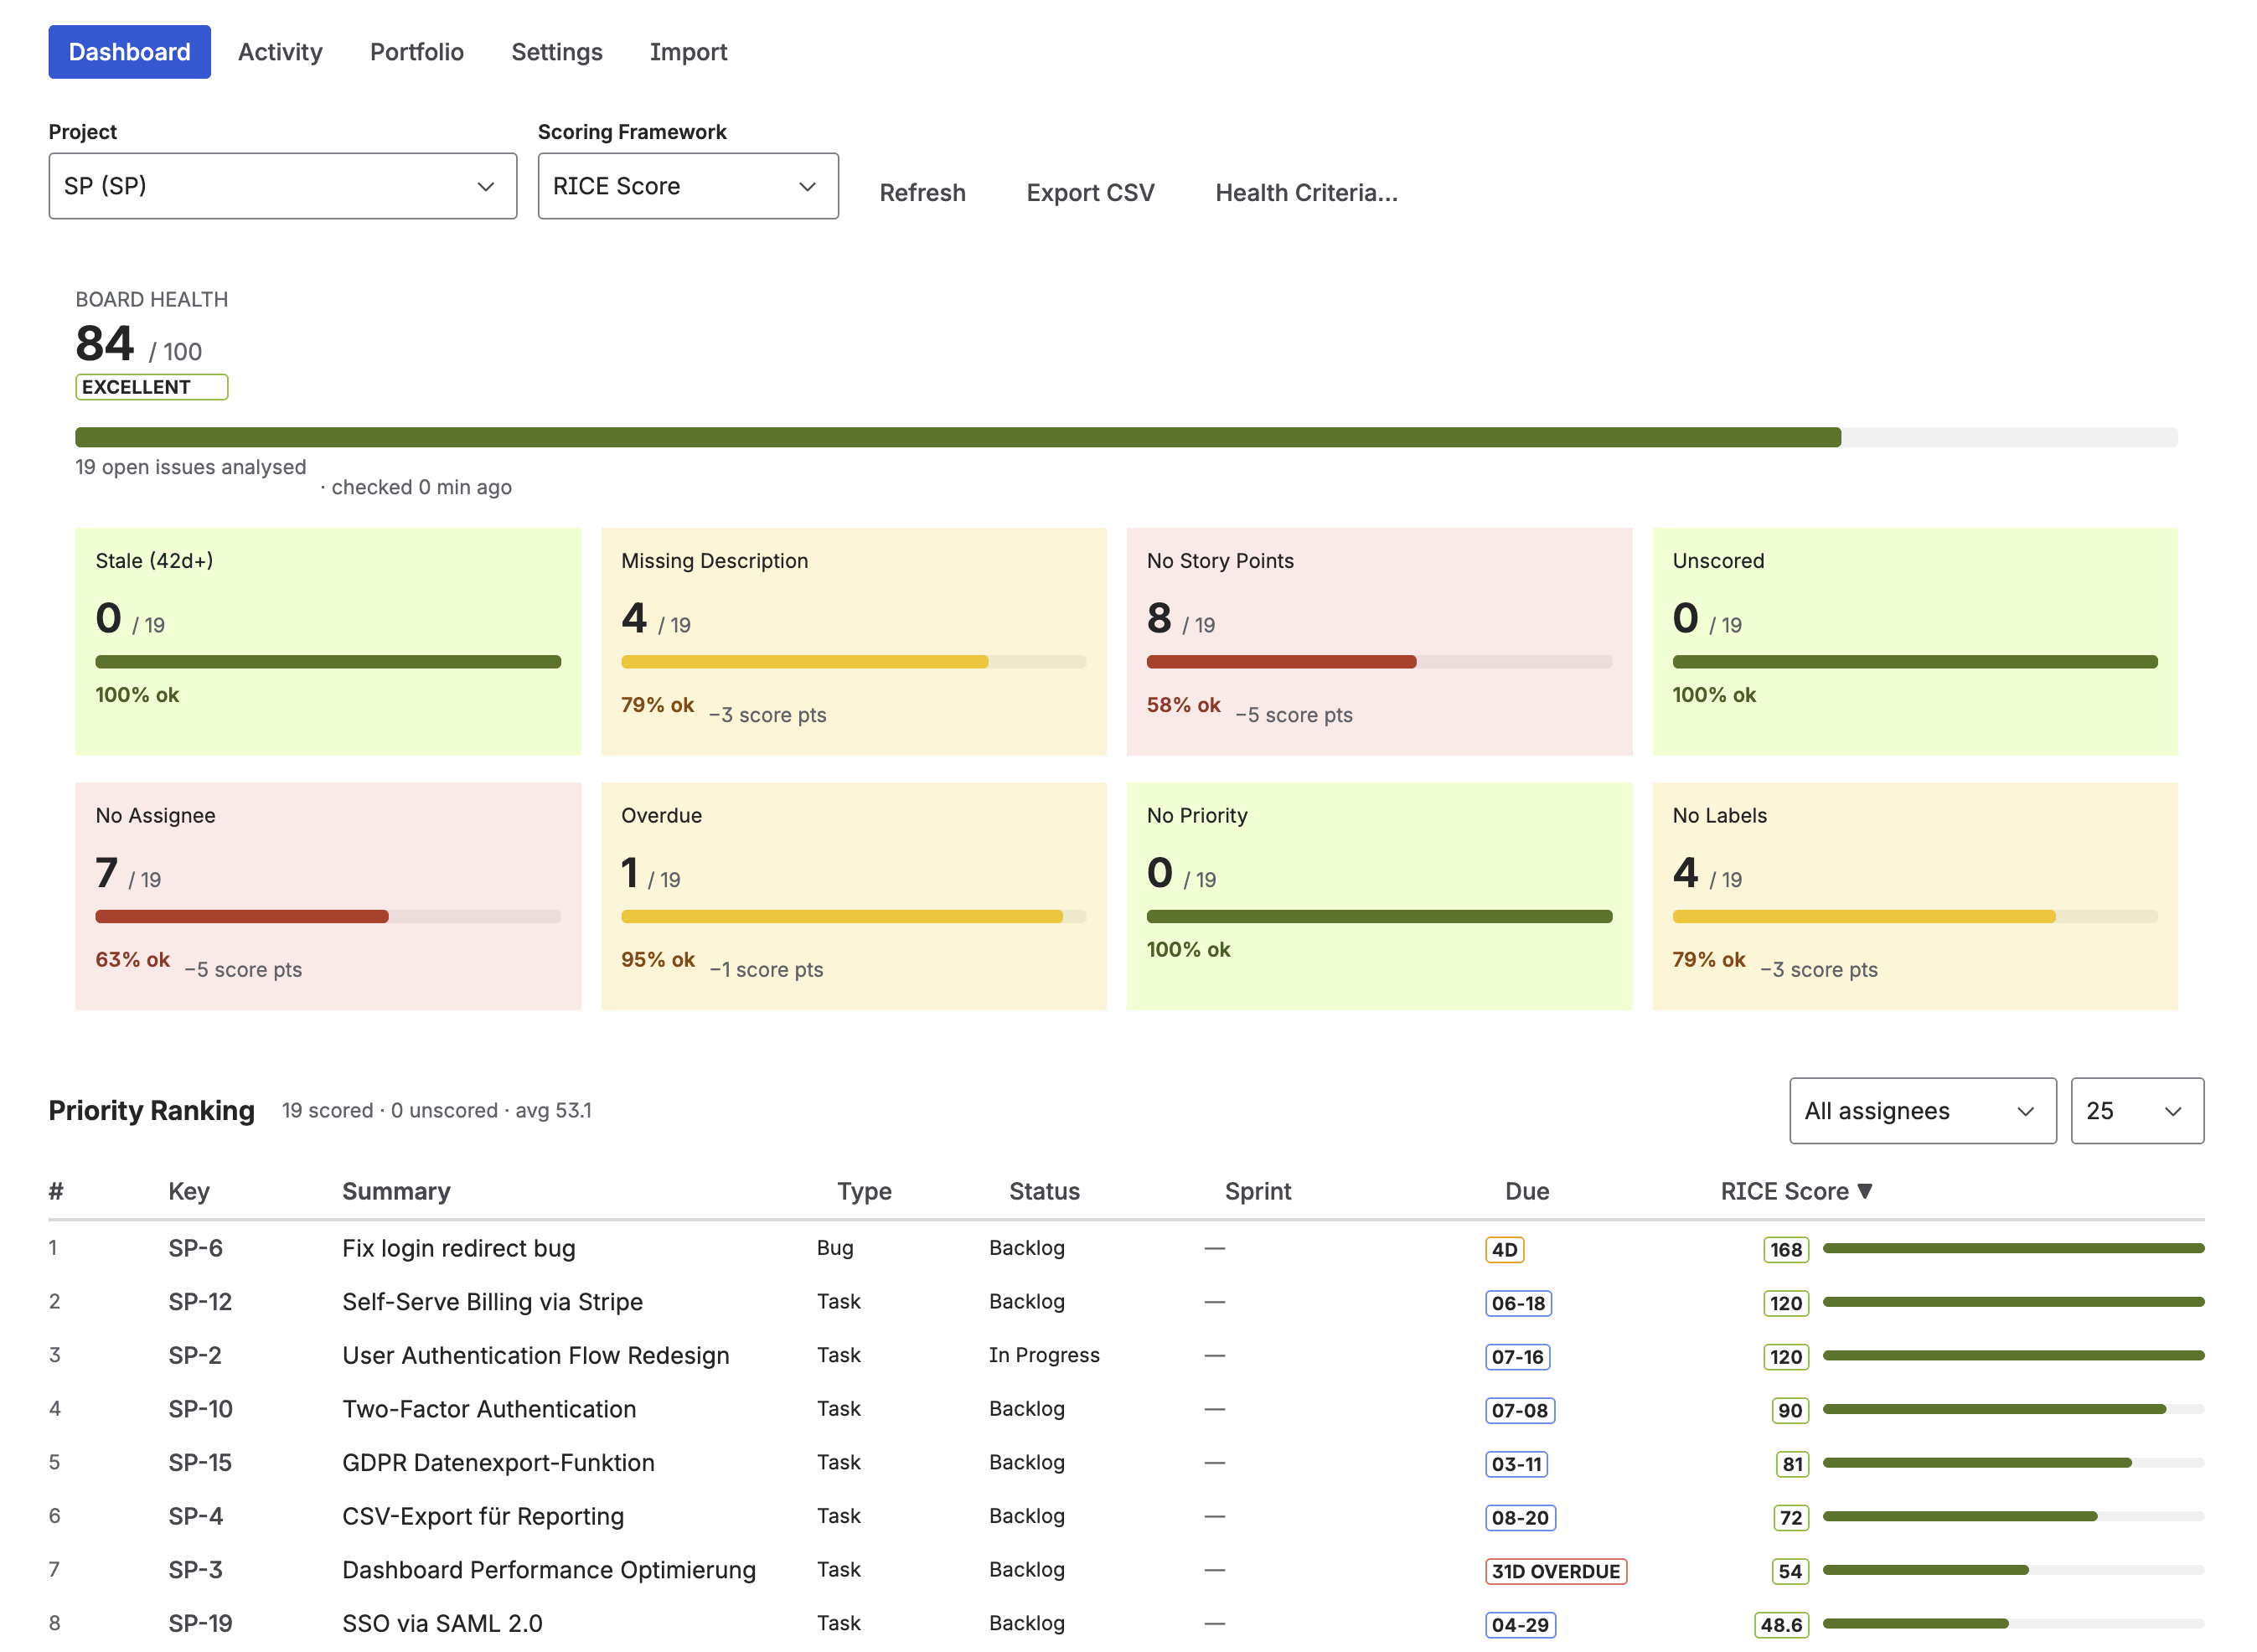
Priority Scoring dashboard — ICE scores ranked across backlog issues, with Board Health and Portfolio view alongside
Frequently asked questions
What is ICE scoring in Jira?
ICE is a lightweight prioritization framework that scores each backlog idea on three dimensions: Impact (how much it moves your key metric), Confidence (how certain you are), and Ease (how easy it is to implement). Each is rated 1–10. ICE Score = Impact × Confidence × Ease, giving scores from 1 to 1,000. Jira doesn't include ICE natively — Priority Scoring for Jira adds it as a native custom field.
How do I calculate an ICE score?
ICE Score = Impact × Confidence × Ease. All three dimensions use a 1–10 scale. Example: Impact 8, Confidence 7, Ease 5 → 8 × 7 × 5 = 280. Score all your backlog ideas with the same approach, then sort descending. The absolute value doesn't matter — only the ranking across your backlog does.
What is the difference between ICE and RICE scoring?
RICE adds a Reach dimension (how many users are affected) and an Effort denominator, making it more precise but requiring user data. ICE skips Reach, so it's faster to fill in but can't distinguish between ideas that affect 10 users vs. 10,000. Start with ICE when you lack reach data — switch to RICE when you have user analytics that make Reach estimable and meaningful.
Does Jira have built-in ICE scoring?
No. Jira Cloud does not include ICE scoring out of the box. Priority Scoring for Jira adds ICE as a native custom field — sliders for each dimension, automatic score calculation, and a ranked backlog view — all without scripting or custom Automation rules. ICE is the default framework when you first open the app.
When should I use ICE instead of RICE or WSJF?
Use ICE when you need to move fast, have many small ideas to triage, and don't have reliable reach data. It's ideal for growth teams running experiments and early-stage product squads doing discovery. Graduate to RICE when you have user analytics. Use WSJF if you're in a SAFe organization doing PI Planning.
ICE is already set up — just install and score
Priority Scoring for Jira includes ICE as the default framework. Install it, add the field to your project, and score your first backlog idea in under 5 minutes.
Try it free on Marketplace →