The problem: Jira priorities are opinions
Jira gives you a Priority field out of the box — Highest, High, Medium, Low, Lowest. In most teams, 70% of the backlog is "High" within a year. It's not that everything is genuinely high priority. It's that the field is subjective, so people default upward.
The consequence: sprint planning becomes a negotiation. The loudest stakeholder wins. Engineers don't know which ticket to pull next when two "High" issues are waiting. And product managers can't explain — to their team or their leadership — why one feature ships before another.
RICE scoring fixes this by making the trade-offs explicit. Two features can both matter and both be urgent. RICE forces you to say which one matters more, and to show your work.
Quick answer: Jira does not include RICE scoring natively. You add it via a Marketplace app that creates custom fields — sliders for each dimension, automatic score calculation, and a ranking table across your backlog. Setup takes under 10 minutes.
The RICE formula explained
RICE was developed by Sean McBride at Intercom as a way to standardize feature prioritization across a growing product team. The formula has four factors:
Reach — how many people benefit?
Reach is the number of users or customers who will be affected by this feature within a defined time period — typically one quarter. Use real numbers, not percentages. "500 users per quarter" is better than "medium reach."
The key is consistency: all issues in your backlog must use the same time window. Mixing quarterly and annual estimates will skew every score in your ranking.
Impact — how much does it move the needle?
Impact is a multiplier that represents the effect on each individual user. Intercom defined a standard scale to keep estimates comparable across features:
| Impact label | Multiplier | When to use |
|---|---|---|
| Massive | 3× | Core workflow change — users will notice it daily |
| High | 2× | Significant improvement — noticeably faster or easier |
| Medium | 1× | Useful addition — nice to have, some will use it |
| Low | 0.5× | Minor improvement — affects edge cases or power users |
| Minimal | 0.25× | Negligible effect on most users |
Impact is the most subjective dimension. The multiplier scale helps — it forces you to commit to "this is 2× better than average" rather than vague labels like "important."
Confidence — how sure are you?
Confidence is expressed as a percentage and reflects how well-supported your estimates are. Intercom's original guidance suggested three levels: 100% (high confidence — you have data), 80% (medium — some data, some assumption), 50% (low — mostly assumption). Values below 50% are valid but signal that the issue needs more discovery before scoring reliably.
Confidence acts as a risk discount. A feature with a fantastic RICE score at 50% confidence will rank lower than a more modest feature at 100% confidence — which is exactly what you want. Don't inflate confidence to make a pet feature look good.
Effort — how much does it cost?
Effort is the total time all team members will spend on this issue, expressed in person-months. A frontend engineer and a backend engineer working for two weeks each = 1 person-month. Include QA, design, and PM time — not just engineering.
Effort is the denominator: a high-effort issue is penalized even if it has excellent reach and impact. This is RICE's key insight — it's not just about value delivered, but value per unit of work.
A worked example
Let's score two features competing for the same sprint slot:
Feature B ranks higher — despite being wanted by far fewer users — because it delivers twice the impact per user, costs a quarter of the effort, and you're certain it will work. RICE surfaces this trade-off cleanly where a pure "Priority: High" label on both would hide it entirely.
Common mistake: Mixing time windows for Reach. If one issue uses "annual users" and another uses "monthly active users," the scores are not comparable. Decide on a time window (typically one quarter) and use it for every issue in the backlog.
When RICE is the right fit — and when it isn't
RICE works best when your team can estimate reach with real data — user analytics, support ticket volume, interview counts. It rewards features that affect many people, which aligns well with product teams working on consumer-facing or broadly-used software.
RICE is less suited for teams where:
- You're in SAFe / PI Planning: Use WSJF (Weighted Shortest Job First) instead — it models cost of delay and job duration, which maps better to SAFe sequencing decisions.
- You have many small ideas and limited discovery time: ICE (Impact, Confidence, Ease) is faster to fill in and gives directionally correct results without requiring user data.
- Your issues are large epics: RICE scores on epics mix concerns and become unreliable. Break epics into stories first, then score.
For teams unsure which framework fits, see the comparison guide: RICE vs. WSJF vs. ICE — which Jira framework is right for you?
How to set up RICE scoring in Jira
The steps below use Priority Scoring for Jira — a Forge-native app that adds RICE, WSJF, and ICE as native custom fields. It runs entirely on Atlassian's infrastructure ("Runs on Atlassian" badge), so no data leaves your Jira site.
-
1Install Priority Scoring from the Atlassian Marketplace. Search for "Priority Scoring" and install it to your Jira Cloud site. A free trial is available with all features included.
-
2Add the RICE Score field to your project screen. Go to Jira Settings → Work Items → Screens, find the screen for your project, and add the "Priority Scoring — RICE" field. Without this step, the sliders won't appear on issues.
-
3Open a Jira issue and set your first RICE score. You'll see four sliders — Reach, Impact, Confidence, and Effort. Drag each slider to the appropriate value. The RICE score is calculated live and displayed above the sliders.
-
4View your ranked backlog in the Priority Scoring dashboard. Open the Priority Scoring global page. Switch to the RICE framework, select your project, and see all scored issues ranked from highest to lowest score — with sprint, due date, and assignee columns.
-
5(Optional) Configure score thresholds. In Settings, set Low and High thresholds for the RICE framework. Issues below the low threshold display a 🔴 badge; above the high threshold a 🟢. Teams at a glance see which issues are priority without reading individual scores.
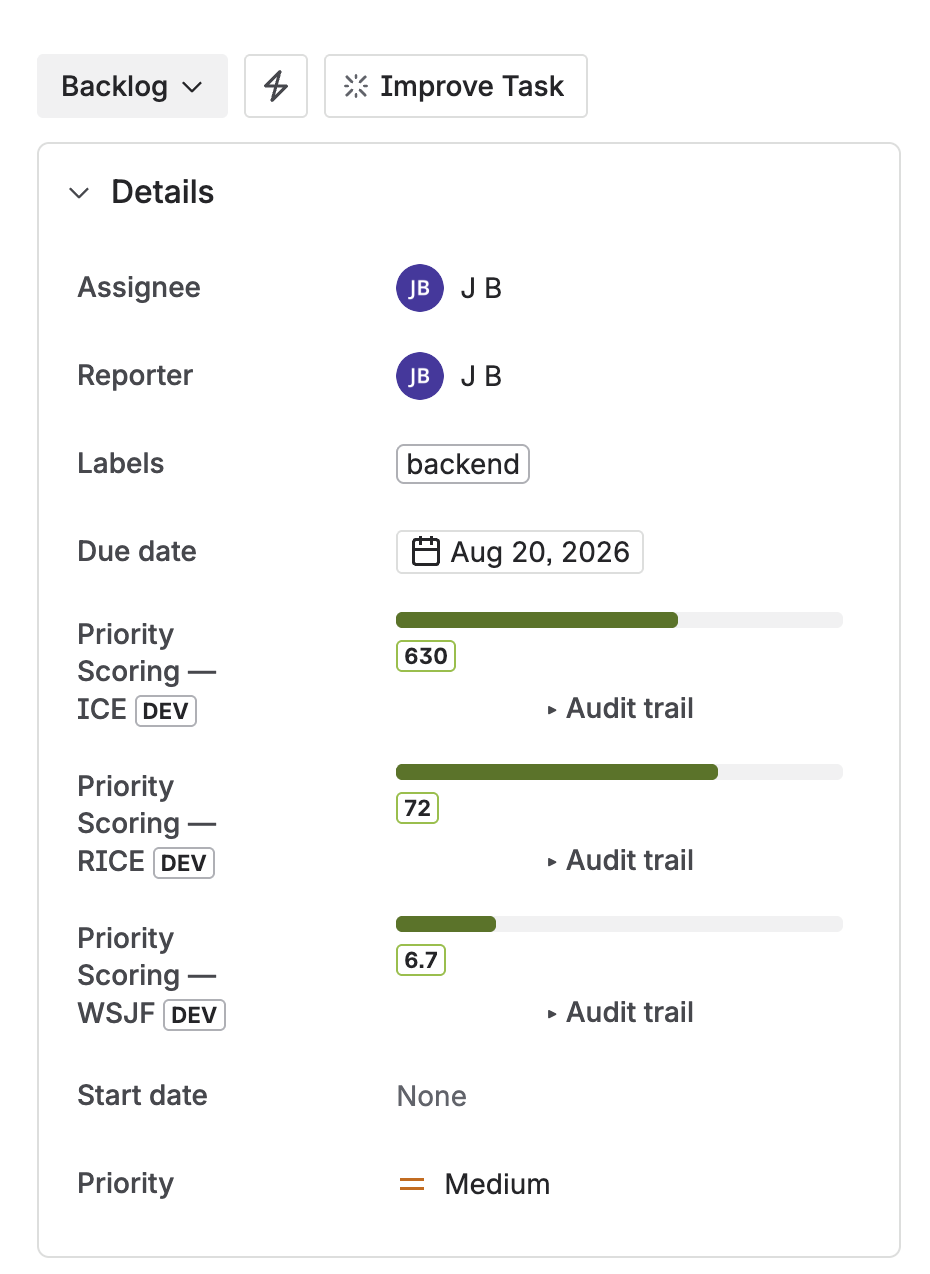
RICE, WSJF, and ICE score fields on a Jira issue — sliders for each dimension, score calculated live
Seeing your ranked backlog
Individual issue scores are useful, but the real value is the ranked view across your entire project. The Priority Scoring dashboard shows a sortable table of all scored issues — rank, RICE score (with color badge), issue key, summary, sprint, assignee, and due date.
Sort descending to work from the top. Issues sitting at the bottom of the ranking — especially those with a 🔴 badge — are the ones to question: should they be in the backlog at all?
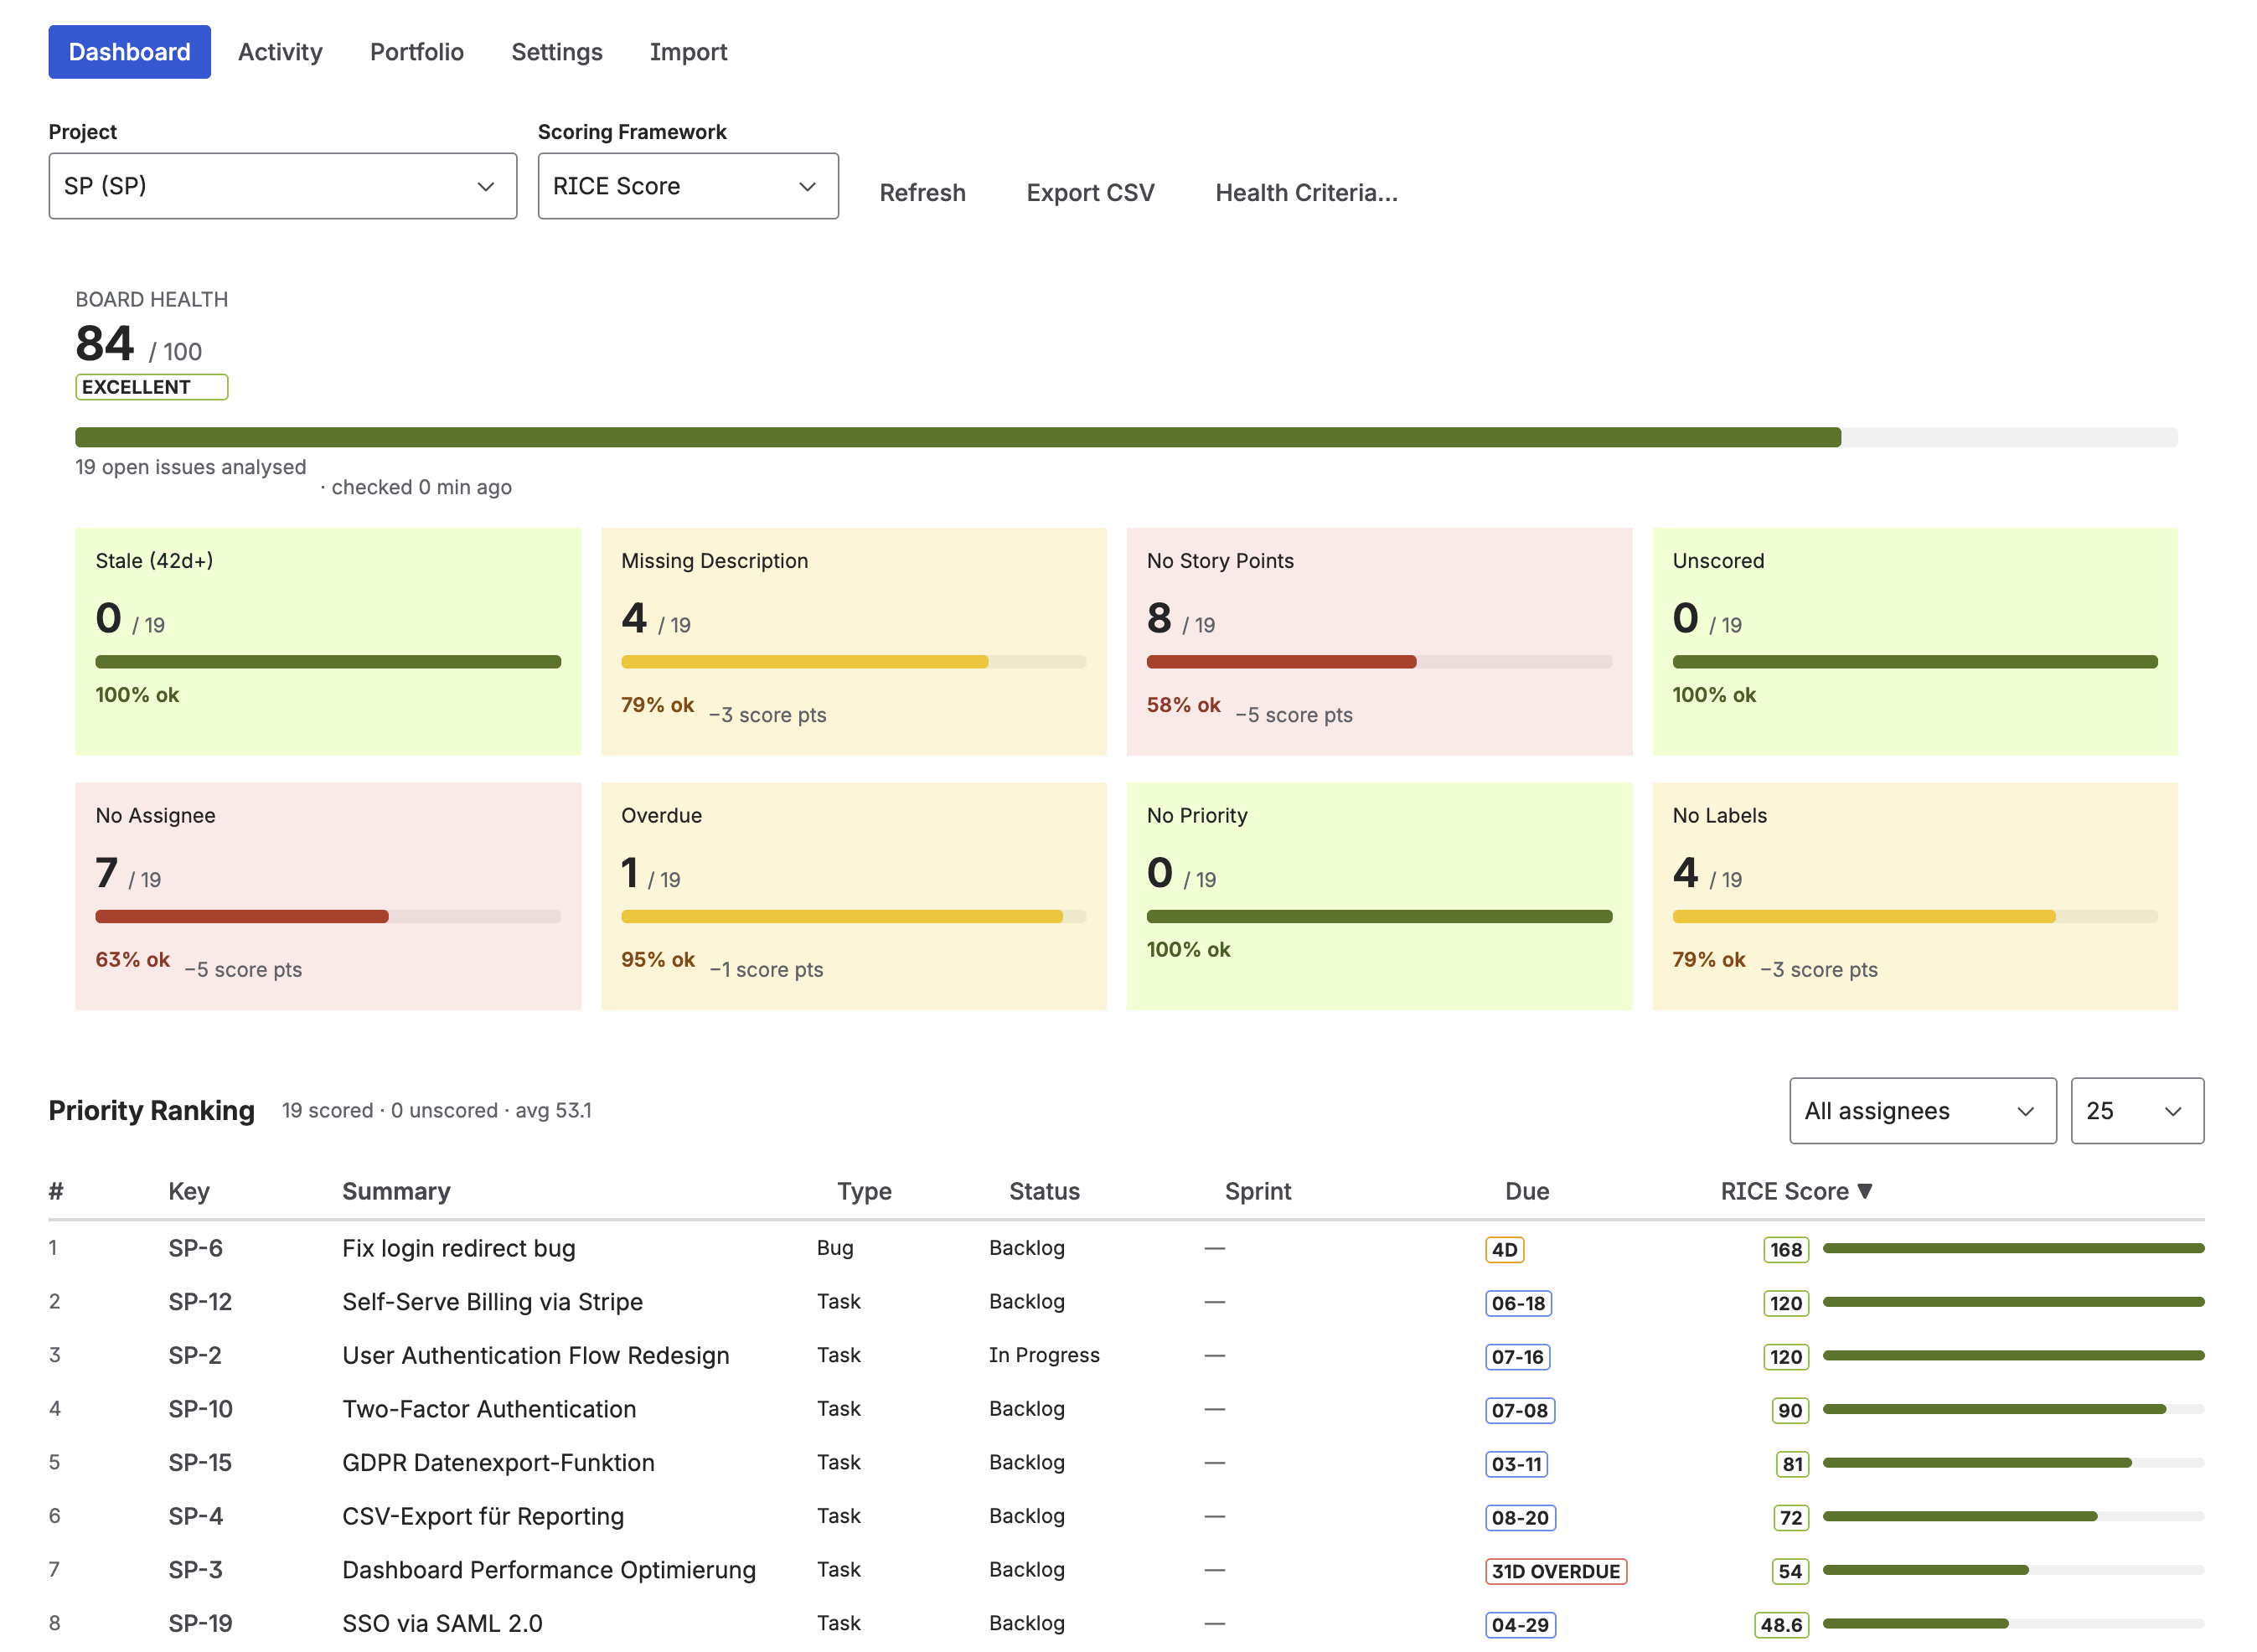
Priority Scoring dashboard — ranked RICE scores across all backlog issues, with Board Health panel on the right
Going further: AI-assisted scoring with Rovo
Scoring every issue manually is the biggest adoption barrier for RICE. Priority Scoring includes a Rovo AI Agent that reads issue content — summary, description, acceptance criteria — and suggests dimension values with written reasoning.
The agent operates in three modes, configurable in Settings:
- Suggest mode: Rovo recommends values in the chat, you apply them manually via sliders. Good starting point for teams new to AI-assisted scoring.
- Confirm mode: Rovo asks "Shall I apply this RICE score to PROJ-123?" and waits for your approval before writing to Jira.
- Auto mode: Rovo applies scores directly — Atlassian's native permission dialog still appears as a platform-level safeguard.
To score an issue via Rovo, open a Rovo chat and type: "Suggest a RICE score for PROJ-123." Rovo fetches the issue, reasons through the dimensions, and returns suggested values. In confirm or auto mode, it can then write the score to the field directly.
Bulk scoring is available in auto mode: "Score all unscored issues in project PROJ with RICE." Rovo works through the list up to the configured bulk limit (default: 10 issues per call).
Note on AI suggestions: Rovo's suggestions are a starting point, not a verdict. Impact and Confidence in particular benefit from human review — the AI doesn't know your company's strategic bets or which customer segments matter most this quarter. Use Suggest or Confirm mode until you've calibrated the agent's judgment against your own.
Keeping scores consistent across your team
RICE scoring only works if the team uses the same definitions. A Reach of "1,000 users" means nothing if one person estimates monthly users and another estimates total registered users. Before you start, agree on three things:
- Time window for Reach — pick one (quarterly is standard) and never mix it.
- What "users" means — all registered users? Monthly active? Paying customers? Write it down.
- Effort unit — person-weeks or person-months, your choice, but stick to it.
The Score Audit Trail in Priority Scoring (Settings → Score Audit Trail) logs who set what value and when, which helps teams spot outliers and recalibrate over time.
Frequently asked questions
What is RICE scoring in Jira?
RICE is a product prioritization framework that scores each backlog item using four factors: Reach (how many users are affected), Impact (how much it moves the needle), Confidence (certainty of estimates), and Effort (total team time). The score formula is (Reach × Impact × Confidence) ÷ Effort. Jira doesn't include RICE natively — you add it with an app like Priority Scoring for Jira.
How do I calculate a RICE score?
Multiply Reach × Impact × Confidence, then divide by Effort. Example: 200 users/quarter × 1 (medium impact) × 0.8 (80% confidence) ÷ 2 person-months = RICE Score of 80. A higher score means higher priority. Compare scores across your backlog — the absolute value doesn't matter, only the ranking.
Does Jira have built-in RICE scoring?
No. Jira Cloud does not include RICE scoring out of the box. You add it through the Atlassian Marketplace. Priority Scoring for Jira adds native RICE custom fields (sliders per dimension, automatic calculation) directly to the issue view — no scripting or custom Automation rules needed.
What is a good RICE score?
RICE scores are relative, not absolute. What matters is the ranking across your backlog, not the number itself. A score of 50 might be top-tier in one backlog and average in another. Use color-coded thresholds (🟢🟡🔴) to highlight the top and bottom of your ranking at a glance — Priority Scoring for Jira lets you configure these thresholds per framework.
What is the difference between RICE, WSJF, and ICE in Jira?
RICE is best for product teams prioritizing features by user impact. WSJF is designed for SAFe engineering orgs and focuses on cost of delay. ICE is a faster, simpler framework for teams that need quick directional scoring without detailed data. All three are supported as native custom fields in Priority Scoring for Jira.
Can I use RICE scoring in Jira without scripting?
Yes. Priority Scoring for Jira adds RICE as a native custom field — no ScriptRunner, no Automation rules, no formulas to maintain. Install the app, add the field to your project screen, and the sliders are immediately available on every issue.
Add RICE scoring to your Jira backlog
Priority Scoring for Jira — native RICE, WSJF, and ICE fields, Rovo AI agent, Board Health score, and Portfolio view. Free trial included.
Try it free on Marketplace →