WSJF in the SAFe context
The Scaled Agile Framework defines WSJF as the primary method for sequencing work on the ART (Agile Release Train) backlog. It's used at the Program level — for Features and Enablers — not at the team level, where individual stories are estimated with story points during iteration planning.
The conceptual basis comes from Don Reinertsen's work on lean product development and flow economics: jobs with a high cost of delay should be delivered before jobs with a low cost of delay, and short jobs should be preferred over long ones when the cost of delay is similar. SAFe formalizes this into a calculable ratio.
A few terms worth having clear before going further:
- ART (Agile Release Train) — a long-lived team of teams, typically 50–125 people, that plans and delivers value together.
- PI (Program Increment) — the planning timebox, typically covering 5 iterations (4 development + 1 Innovation & Planning iteration), most commonly 10 weeks total.
- PI Planning — the 2-day event at the start of each PI where the ART aligns on objectives, capacity, and dependencies.
- RTE (Release Train Engineer) — the chief Scrum Master for the ART; responsible for facilitating PI Planning and the overall ART process.
- Feature — a service or function that delivers business value in a PI, typically owned by Product Management and broken into Stories for team execution.
Scope of WSJF: WSJF scores Features, not Stories. Product Management scores the ART backlog before PI Planning. Teams then break committed Features into Stories during team breakouts — story sizing uses story points, not WSJF.
The WSJF formula
SAFe defines WSJF as Cost of Delay divided by Job Size. Cost of Delay is itself composed of three dimensions — each scored on the same relative scale:
The third numerator dimension — Risk Reduction and Opportunity Enablement (RR|OE) — is sometimes overlooked but often the deciding factor for infrastructure or platform Features. An API gateway refactor may have modest Business Value this PI, but it enables five downstream Features next PI. That opportunity enablement should be scored, not ignored.
Relative scoring with the Fibonacci scale
SAFe uses a modified Fibonacci sequence for all four WSJF dimensions: 1, 2, 3, 5, 8, 13, 20. All scoring is relative — you are not assigning absolute values, you are comparing Features against each other.
The correct process: for each dimension, identify the Feature that represents the highest value in your current backlog and anchor it at a high Fibonacci number (often 8 or 13). Then score all other Features relative to that anchor. A Feature with half the Business Value of your anchor gets half the score.
The gaps between Fibonacci numbers get larger as the scale goes up — that's intentional. It forces you to make meaningful distinctions at the high end (is this really a 13 or a 20?) while avoiding false precision at the low end (1 vs. 2 vs. 3 are all "small," the exact distinction is less important).
Don't anchor everything at 13 or 20. A common mistake in first PI Planning cycles is scoring most Features high on all dimensions. This collapses the ranking — everything ends up near the same WSJF score. The value of relative scoring comes from differentiation: some Features really are 3× more time-critical than others, and the scale needs to reflect that.
A worked example: 6-feature ART backlog
Here's how five Features from a hypothetical ART backlog score out. Business Value, Time Criticality, and RR|OE are each anchored against the highest-value Feature in each dimension. Job Size represents relative duration.
| Feature | BV | TC | RR|OE | CoD | JS | WSJF |
|---|---|---|---|---|---|---|
| SSO integration for enterprise accounts | 8 | 13 | 5 | 26 | 8 | 3.25 |
| API rate limiting + abuse protection | 5 | 8 | 13 | 26 | 5 | 5.20 |
| Bulk CSV export for filtered views | 13 | 3 | 1 | 17 | 3 | 5.67 |
| Dashboard widget customization | 8 | 2 | 1 | 11 | 5 | 2.20 |
| Mobile push notifications | 5 | 5 | 2 | 12 | 8 | 1.50 |
| CoD = Business Value + Time Criticality + Risk Reduction/OE | WSJF = CoD ÷ Job Size | All dimensions scored on SAFe Fibonacci scale (1–20) | ||||||
The ranking result — Bulk CSV (5.67) → API rate limiting (5.20) → SSO (3.25) → Dashboard widgets (2.20) → Mobile notifications (1.50) — is counterintuitive at first glance. SSO has the highest Business Value score (13 doesn't even appear for BV here because it was anchored at 13 only for TC), but it loses ground because it's a large job. The Bulk CSV Feature scores highest because it's small, moderately urgent, and delivers clear value: a relatively cheap Feature to deliver for its cost of delay.
This is the core insight WSJF surfaces: large, high-value Features are not automatically the right Features to do first, because they take so long to deliver that smaller, moderately valuable Features can be completed and shipped earlier — generating value sooner.
Where WSJF fits in the PI Planning flow
SAFe describes a specific sequence of activities around PI Planning. WSJF scoring happens before the event, as part of Product Management's preparation:
-
1Product Management scores all candidate Features with WSJF (2–3 weeks before PI Planning). The ranked backlog gives teams a clear starting point. Features at the top have the highest economic justification for delivery this PI.
-
2Business Owners validate Business Value scores (pre-PI). In SAFe, Business Owners — not just Product Management — assign Business Value. This stakeholder input is the basis for the BV dimension. In many organizations this happens in a Business Owner briefing session 1–2 days before PI Planning.
-
3PI Planning Day 1: Management presents the top-ranked backlog. The ranked WSJF list is presented during the "Product Management Vision" and "Architecture Vision" sessions. Teams understand which Features are economically justified first, before they plan their iterations.
-
4Teams pull from the ranked backlog during team breakouts. Each Agile team commits to PI Objectives and iteration plans by pulling Features from the WSJF-ranked list, adjusted for capacity constraints and dependencies mapped on the Program Board.
-
5PI Planning Day 2: confidence vote and risk review. The ART presents consolidated PI Objectives. Business Owners score team objectives on a 1–10 Business Value scale (this is a separate scoring from WSJF — it validates commitment, not sequencing). WSJF remains the sequencing reference throughout the PI.
Setting up WSJF in Jira for your ART
The steps below use Priority Scoring for Jira — a Forge-native app that adds WSJF as a native custom field. It runs entirely on Atlassian's infrastructure, which matters for enterprise teams with data residency requirements.
-
1Install Priority Scoring for Jira from the Atlassian Marketplace. The WSJF field is included with all other scoring frameworks. A free trial with full features is available.
-
2Add the WSJF Score field to your Feature project screen. Go to Jira Settings → Work Items → Screens, find the screen for your ART backlog project, and add the "Priority Scoring — WSJF" field. This makes the four WSJF sliders (BV, TC, RR|OE, JS) visible on every Feature issue.
-
3Anchor your highest-value Feature first. Open the Feature with the highest Business Value in your current backlog and set its BV slider to 8 or 13. All other Features will be scored relative to this anchor. Repeat the anchoring process for Time Criticality and RR|OE — each dimension gets its own anchor.
-
4Score all candidate Features relative to their anchors. Work through the backlog Feature by Feature. For each dimension, ask: "How does this Feature compare to the anchor?" A Feature worth half the Business Value of the anchor gets half the BV score. The WSJF score calculates automatically.
-
5Open the Priority Scoring dashboard and switch to WSJF view. Select your ART backlog project. The dashboard shows all scored Features ranked by WSJF score — descending, with Business Value, Time Criticality, RR|OE, Job Size, and final WSJF score visible in columns. This is the list you present on Day 1 of PI Planning.
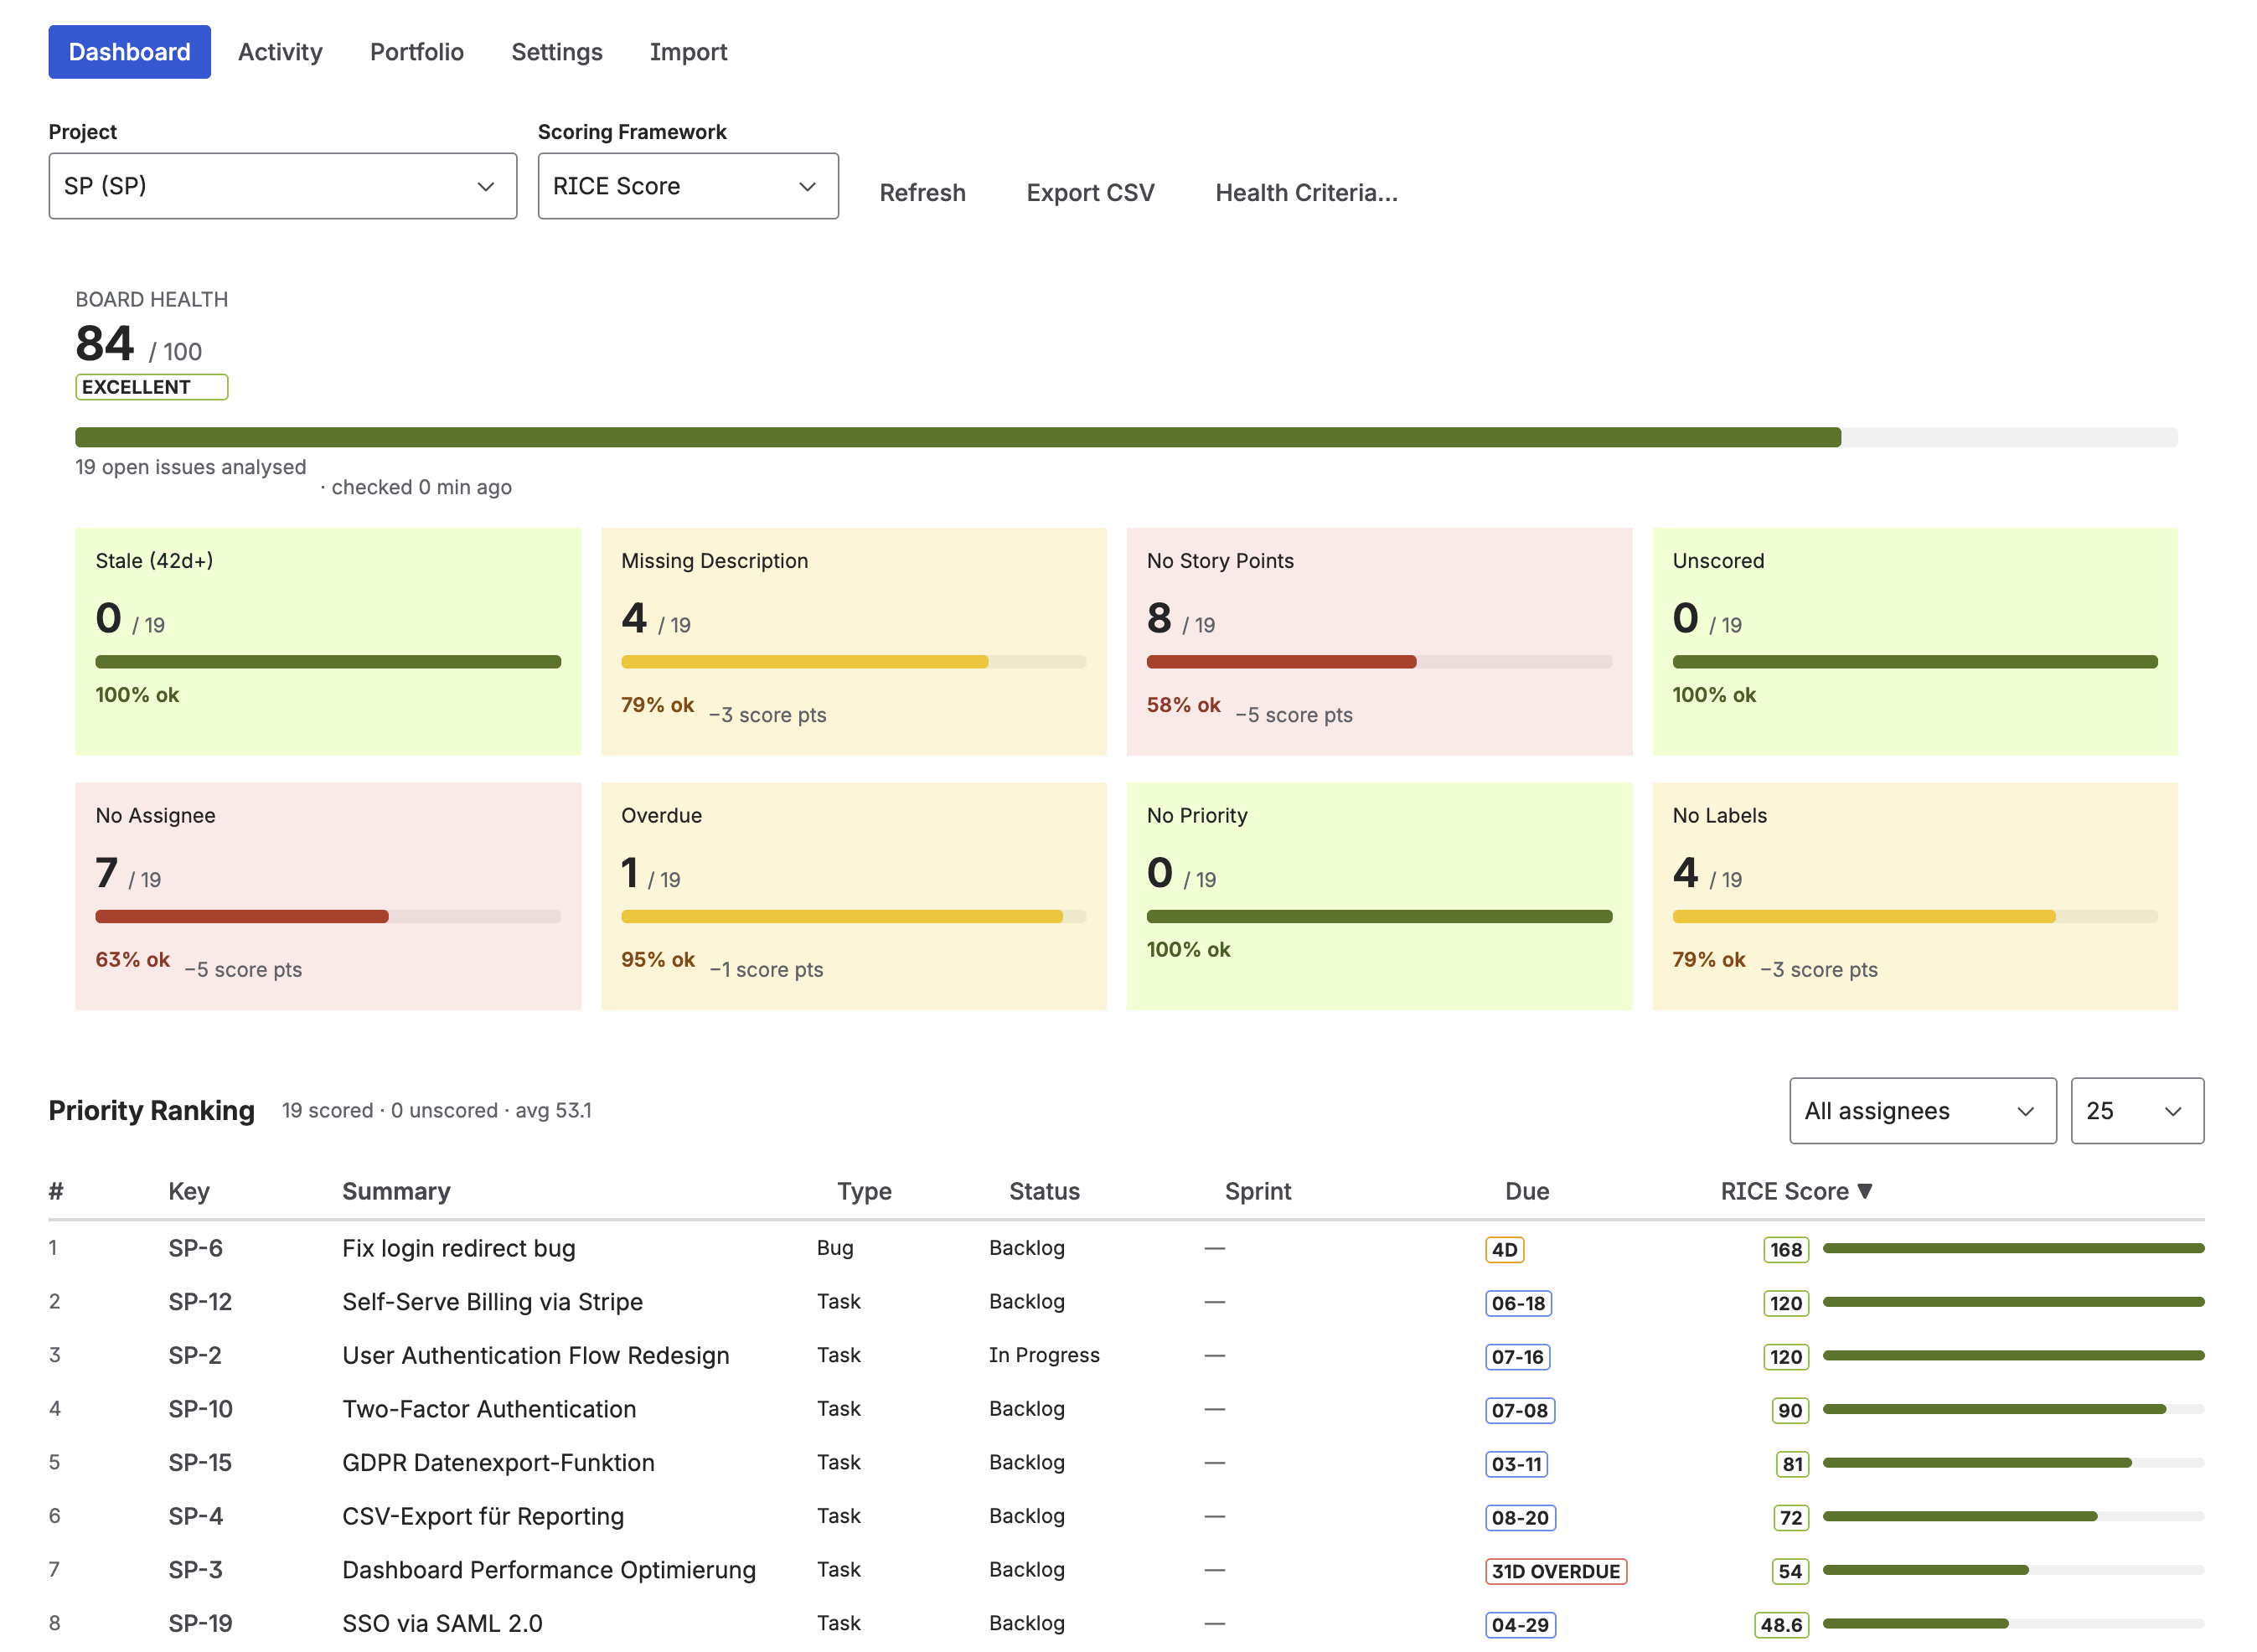
Priority Scoring dashboard — WSJF-ranked Features ready for PI Planning, with dimension scores and Board Health panel
Dimension weights and Job Size
Priority Scoring supports Dimension Weights (×1–×5) for the numerator dimensions — Business Value, Time Criticality, and Risk Reduction/OE can each be weighted independently. If your organization treats Time Criticality as twice as important as Risk Reduction in sequencing decisions, you can reflect that with a ×2 weight on TC.
Note that Job Size — the denominator — is intentionally not weightable. Weighting the denominator would invert its effect: a ×2 weight on Job Size would make large jobs appear more attractive, which is the opposite of what WSJF is designed to do. SAFe's WSJF formulation treats Job Size as a pure duration proxy, not a value dimension.
For standard SAFe implementations: keep all dimension weights at ×1 to match the unmodified SAFe WSJF formula. Weights are useful when your organization has empirically determined that one dimension is a stronger predictor of business outcomes than others — use them deliberately, not as a default.
What the RTE sees
The Release Train Engineer's job at PI Planning is to facilitate, not to adjudicate priority debates. A WSJF-ranked backlog in Jira gives the RTE a concrete, shareable artifact: before the event, teams can see which Features are ranked highest and why, reducing the surface area for priority debates during Day 1.
After PI Planning, the WSJF scores remain on the Features and continue to serve as a reference point if new Feature requests arrive mid-PI and need to be inserted or deferred. The question "should we add this to the current PI?" has an objective answer: calculate its WSJF score and compare it to what's already committed.
For more on WSJF fundamentals — the formula, Fibonacci scoring in detail, and a worked comparison with RICE — see the complete WSJF guide: WSJF in Jira: SAFe Prioritization Without Spreadsheets.
Frequently asked questions
What is WSJF in SAFe?
WSJF (Weighted Shortest Job First) is SAFe's method for sequencing ART backlog Features. WSJF = Cost of Delay ÷ Job Size. Cost of Delay = Business Value + Time Criticality + Risk Reduction/OE. All dimensions use a relative Fibonacci scale (1, 2, 3, 5, 8, 13, 20). A higher WSJF score means the Feature should be delivered sooner. Defined by Scaled Agile, rooted in Don Reinertsen's lean flow economics.
How is WSJF used in PI Planning?
Product Management scores candidate Features with WSJF before PI Planning. The ranked list becomes the sequencing input for Day 1 presentations and team breakouts. Teams pull from the top of the WSJF-ranked backlog when building iteration plans, adjusted for capacity and dependencies. Business Owners validate Business Value scores in a pre-PI briefing, typically 1–2 days before the event.
What Fibonacci scale does SAFe use for WSJF?
SAFe uses 1, 2, 3, 5, 8, 13, 20 for all WSJF dimensions. Scoring is always relative — anchor the highest-value Feature in each dimension first, then score all others relative to it. Avoid anchoring everything high: meaningful differentiation between Features is the goal, and a compressed scale defeats the purpose of the ranking.
Can I track WSJF scores in Jira?
Yes. Priority Scoring for Jira adds WSJF as a native custom field — sliders for BV, TC, RR|OE, and Job Size, automatic WSJF calculation, and a ranked dashboard view. It's Forge-native, meaning it runs on Atlassian's own cloud infrastructure with no external servers or API keys required.
What is the difference between WSJF and RICE for Jira prioritization?
WSJF is designed for SAFe organizations sequencing Features by cost of delay. RICE is designed for product teams prioritizing features by user impact and effort. Use WSJF in SAFe PI Planning contexts; use RICE when you can measure how many users are affected and want to weigh features against engineering effort. Both frameworks are available in Priority Scoring for Jira.
Arrive at PI Planning with your ART backlog already ranked
Priority Scoring for Jira adds native WSJF scoring to your Feature backlog — Fibonacci sliders, automatic WSJF calculation, and a ranked dashboard view. Free trial included.
Try it free on Marketplace →